Inferential statistics summary part I
Unit 501: confidence interval for a proportion
Basics to know:
• Dummies are coded (1,0)
• E is basically zero
• Percentage: between 0-100%
• Fraction: between 0-1
• Proportion: between 0-1
Signs:
Population proportion π Greek letter for population
= parameters.
The expected (mean)
proportion.
Sample proportion p Latin letters for sample statistics
Sample mean 𝑥‾
Sample s
Population mean µ
Population parameter: is a numerical value that describes a characteristic of an entire population. It
summarizes some aspect of the population, such as the mean, standard deviation, or proportion.
Population parameters are typically denoted by Greek letters like μ (population mean), sigma
(population standard deviation), or p (population proportion).
,Unit 501: what is in inferential statistics?
Greek Latin
We assume a random sample. Then we can have inference when drawing conclusions about a
population when only using a sample. We go from sample statistics to population.
“To what extent can we say something about the population on the basis of a single sample?”
Example: how many minutes a day are people listening to the radio?
Random sample:
Sample mean 𝑥‾ = 144 minutes
Sample size n = 50
Standard deviation of the sample s = 20.
So 124 – 164 minutes.
Another example:
Sample mean = 144 minutes, sample size n = 5000, sd of the sample s = 20.
Now that the sample size is way bigger, you can be more certain about the population.
It will be closer to the 144 minutes.
Another example:
Sample mean = 144 minutes, sample size n = 50, sd of the sample s = 50.
The differences between people are much bigger, now we are less certain where that mean actually is.
In the sample the spread is more around the mean.
You can’t draw a conclusion about a population.
If you know two, you can make statements about the third.
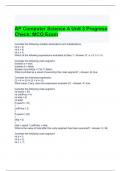
Example: sample statistics, random sample and population parameters.
,501: the sampling distribution of the proportion
Sampling distribution of a proportion
In a large number of samples from a population π, of size n, many will have (slightly) different p’s.
That means that the expected pie is identical to the population proportion. So p = π.
The expected (mean) proportion = π.
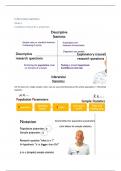
Sampling distribution when π = 0.5, with a sample size n = 1.
With 1, the person is either in favor or against. With sample size 2
With sample size 3 Sample size 10
The bigger the sample size, the more the shape will become a normal distribution.
The sampling distribution of a proportion is similar to a normal distribution. However, not all
proportions are possible, with n = 100, 50.5% is impossible. It can never be smaller than 0 or bigger
than 1. (So use the binomial distribution in an ideal situation).
However we can use the normal distribution as an approximation.
Standard deviation of the sampling distribution a.k.a. the standard error
Important:
The standard deviation of the sampling distribution σₓ̄ is an important concept.
➔ It measures how much the averages from different samples are expected to differ from the
actual population average. A smaller standard deviation means that the sample averages are
more likely to be very close to the population average, giving more accurate estimates.
➔ Standard error = the estimate of the standard deviation of the sampling distribution.
The formula to calculate the standard deviation of the sampling distribution =
σₓ̄ = σ / √n
The bigger the sample size, the less spread out the distribution will be.
➔ Because you are more sure.
Standard error
The standard error in statistics generally depends on sample size (n) and on the
population standard deviation (s).
➔ It shows the spread around the mean.
➔ The standard error is the steps away from the mean, normally you take two standard errors
away from the mean to think about 95% of all of our samples.
SE = σ / √n
, or sqrt p * (1-p) / sqrt n
The standard error also depends on π.
The closer you become to 0.5, the bigger the standard error is. So it depends on the standard
deviation of the population distribution.
Confidence intervals
➔ Gives an indication about how certain we are about the point estimate given by the statistic.
➔ Especially relevant when samples are smaller.
1. Calculate the p.
a. P = number of positive cases / all cases (n)
b. This percentage is your mean. Where you construct the confidence interval around.
c. 95% of the observations lie between + 1.96* p and – 1.96 * p.
The confidence interval of a proportion
Example: how many people in the EU are in favor of nuclear energy?
Are you in favor? (yes, no).
Say 50% of the population is in favor (π = 0.5), and the sample size n is 100.
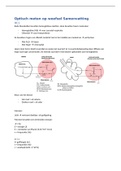
The standard error is:
In this case, 68% of all the random samples will show a percentage between 45% and 55%.
In this case, 95% of all the random samples will show percentages between 40% and 60%.
The margin of error = 1.96 * 0.05 = 10%.
The range 0.40 – 0.60 is called the 95% confidence interval.
The margin of error: when pie is 0.5, and n is 100. The “distance” between the population proportion π
and the sample proportion (p) is very likely to be within 10%.
Unit 501: confidence interval for a proportion
Basics to know:
• Dummies are coded (1,0)
• E is basically zero
• Percentage: between 0-100%
• Fraction: between 0-1
• Proportion: between 0-1
Signs:
Population proportion π Greek letter for population
= parameters.
The expected (mean)
proportion.
Sample proportion p Latin letters for sample statistics
Sample mean 𝑥‾
Sample s
Population mean µ
Population parameter: is a numerical value that describes a characteristic of an entire population. It
summarizes some aspect of the population, such as the mean, standard deviation, or proportion.
Population parameters are typically denoted by Greek letters like μ (population mean), sigma
(population standard deviation), or p (population proportion).
,Unit 501: what is in inferential statistics?
Greek Latin
We assume a random sample. Then we can have inference when drawing conclusions about a
population when only using a sample. We go from sample statistics to population.
“To what extent can we say something about the population on the basis of a single sample?”
Example: how many minutes a day are people listening to the radio?
Random sample:
Sample mean 𝑥‾ = 144 minutes
Sample size n = 50
Standard deviation of the sample s = 20.
So 124 – 164 minutes.
Another example:
Sample mean = 144 minutes, sample size n = 5000, sd of the sample s = 20.
Now that the sample size is way bigger, you can be more certain about the population.
It will be closer to the 144 minutes.
Another example:
Sample mean = 144 minutes, sample size n = 50, sd of the sample s = 50.
The differences between people are much bigger, now we are less certain where that mean actually is.
In the sample the spread is more around the mean.
You can’t draw a conclusion about a population.
If you know two, you can make statements about the third.
Example: sample statistics, random sample and population parameters.
,501: the sampling distribution of the proportion
Sampling distribution of a proportion
In a large number of samples from a population π, of size n, many will have (slightly) different p’s.
That means that the expected pie is identical to the population proportion. So p = π.
The expected (mean) proportion = π.
Sampling distribution when π = 0.5, with a sample size n = 1.
With 1, the person is either in favor or against. With sample size 2
With sample size 3 Sample size 10
The bigger the sample size, the more the shape will become a normal distribution.
The sampling distribution of a proportion is similar to a normal distribution. However, not all
proportions are possible, with n = 100, 50.5% is impossible. It can never be smaller than 0 or bigger
than 1. (So use the binomial distribution in an ideal situation).
However we can use the normal distribution as an approximation.
Standard deviation of the sampling distribution a.k.a. the standard error
Important:
The standard deviation of the sampling distribution σₓ̄ is an important concept.
➔ It measures how much the averages from different samples are expected to differ from the
actual population average. A smaller standard deviation means that the sample averages are
more likely to be very close to the population average, giving more accurate estimates.
➔ Standard error = the estimate of the standard deviation of the sampling distribution.
The formula to calculate the standard deviation of the sampling distribution =
σₓ̄ = σ / √n
The bigger the sample size, the less spread out the distribution will be.
➔ Because you are more sure.
Standard error
The standard error in statistics generally depends on sample size (n) and on the
population standard deviation (s).
➔ It shows the spread around the mean.
➔ The standard error is the steps away from the mean, normally you take two standard errors
away from the mean to think about 95% of all of our samples.
SE = σ / √n
, or sqrt p * (1-p) / sqrt n
The standard error also depends on π.
The closer you become to 0.5, the bigger the standard error is. So it depends on the standard
deviation of the population distribution.
Confidence intervals
➔ Gives an indication about how certain we are about the point estimate given by the statistic.
➔ Especially relevant when samples are smaller.
1. Calculate the p.
a. P = number of positive cases / all cases (n)
b. This percentage is your mean. Where you construct the confidence interval around.
c. 95% of the observations lie between + 1.96* p and – 1.96 * p.
The confidence interval of a proportion
Example: how many people in the EU are in favor of nuclear energy?
Are you in favor? (yes, no).
Say 50% of the population is in favor (π = 0.5), and the sample size n is 100.
The standard error is:
In this case, 68% of all the random samples will show a percentage between 45% and 55%.
In this case, 95% of all the random samples will show percentages between 40% and 60%.
The margin of error = 1.96 * 0.05 = 10%.
The range 0.40 – 0.60 is called the 95% confidence interval.
The margin of error: when pie is 0.5, and n is 100. The “distance” between the population proportion π
and the sample proportion (p) is very likely to be within 10%.