PART TWO: INFERENTIAL STATISTICS
Unit 550: multivariate regression addition: the effect of two variables
Describing and testing the relationship between a dependent scale variable and two independent
variable a dummy and a ratio variable
Example: EQ emotional intelligence
Expectations:
Model: addition. Both education and family type both affect your intelligence.
There are also other models were there are 2 independent variables.
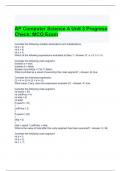
Combining the effect of education and type on EQ in one linear equation: addition
Dependent = intercept + verschil in lijnen * Family Type () + Beta1 (slope) education
Beta0 is altijd de slope. Beta1 is altijd de slope.
Beta 2 is the additional effect = verschil in lijnen.
When analyzing data, always check
1. Independent cases condition
2. Random selection of cases
3. (10% condition)
4. “Even distribution of the variables” (NNC)
,So in this case, check at least the distribution of the variables first.
A deterministic relationship is NOT expected
Randomness is displayed in a normal distribution. The errors will be normally/equally distributed.
Always check that the residuals are normal and equal across the lines and the groups.
If they are not equally distributed, we need another model.
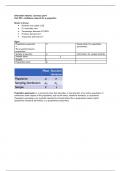
t-test
General expectation: f-test: how likely it is that a mean from 0 is actually from a population where the
mean is actually zero.
T-test: difference between two means in a population. Also studying the mean over time. A lot of
means.
Conclusions?
Level of education is not having an effect while the family type does have an effect.
Unit 550, video 2: the effect of two ratio variables on another scale (ratio) variable
Describing & testing the relationship between a dependent scale variable & two independent ratio
variables
Example:
,In a ‘review study’ the units are (n) ‘papers’.
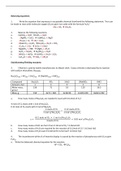
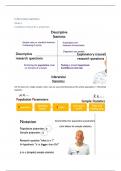
Combining the effect of education and age on ageism in one linear equation: addition
Taking ‘age’ to be the main effect to be displayed, how to visualize the additional effect of education?
We look at age first, and then look at the differences of education.
Education can be 0,1,2 ...?
Dependent (ageism) = intercept + slope * age + Beta2 education (b coefficient).
, Both have a negative effect. Level of education goes down, level of ageism goes down.
The lines are parallel, the difference in the lines are the differences in the intercept.
Intercept: the level of ageism if both age and education are zero.
Checking residuals now becomes less easy using simple visual inspection: normality, equal variance.
In multiple regression, two types of expectations
Unit 550: multivariate regression addition: the effect of two variables
Describing and testing the relationship between a dependent scale variable and two independent
variable a dummy and a ratio variable
Example: EQ emotional intelligence
Expectations:
Model: addition. Both education and family type both affect your intelligence.
There are also other models were there are 2 independent variables.
Combining the effect of education and type on EQ in one linear equation: addition
Dependent = intercept + verschil in lijnen * Family Type () + Beta1 (slope) education
Beta0 is altijd de slope. Beta1 is altijd de slope.
Beta 2 is the additional effect = verschil in lijnen.
When analyzing data, always check
1. Independent cases condition
2. Random selection of cases
3. (10% condition)
4. “Even distribution of the variables” (NNC)
,So in this case, check at least the distribution of the variables first.
A deterministic relationship is NOT expected
Randomness is displayed in a normal distribution. The errors will be normally/equally distributed.
Always check that the residuals are normal and equal across the lines and the groups.
If they are not equally distributed, we need another model.
t-test
General expectation: f-test: how likely it is that a mean from 0 is actually from a population where the
mean is actually zero.
T-test: difference between two means in a population. Also studying the mean over time. A lot of
means.
Conclusions?
Level of education is not having an effect while the family type does have an effect.
Unit 550, video 2: the effect of two ratio variables on another scale (ratio) variable
Describing & testing the relationship between a dependent scale variable & two independent ratio
variables
Example:
,In a ‘review study’ the units are (n) ‘papers’.
Combining the effect of education and age on ageism in one linear equation: addition
Taking ‘age’ to be the main effect to be displayed, how to visualize the additional effect of education?
We look at age first, and then look at the differences of education.
Education can be 0,1,2 ...?
Dependent (ageism) = intercept + slope * age + Beta2 education (b coefficient).
, Both have a negative effect. Level of education goes down, level of ageism goes down.
The lines are parallel, the difference in the lines are the differences in the intercept.
Intercept: the level of ageism if both age and education are zero.
Checking residuals now becomes less easy using simple visual inspection: normality, equal variance.
In multiple regression, two types of expectations