Correlation testing through Multiple Linear Regression
Multiple linear regression test
(statistics → fit models → linear regression)
Simple linear regression: used for testing whether there is a correlation between two variables.
Coefficients / b’s:
• b0 = estimated intercept (estimated value of the dependent variable (Y) when the independent
variable(s) (a.k.a. X-variable, a.k.a. predictor) is zero.
• b1 = estimated coefficient/slope of regression line (change in Y for one-unit change in X).
With B0 and B1, you can determine the expected Y-value (e.g. weight) for a certain X-value (e.g. length), with
the following formula: Yi = b0 + b1 x X1i + ei
- Linear regression works with ‘errors’ (ε) instead of standard deviations. A residual error is the deviation of
a data point / observation from the regression line. The residual standard error (RSE / σε) is basically the
average deviation of data points from the regression line, so it is pretty much similar to standard deviation.
Multiple linear regression: testing for correlation between multiple variables.
Formula:
- b0 = Y-value when all X-values = 0
- Fill in the variable names for the X’s (and if you have more than 1 b for a nominal/ordinal variable, the category
indications as well
• Per variable you have to add a coefficient / b.
o If a variable is ratio or interval: one coefficient has to be estimated for that variable (add one b)
o If a variable is nominal or ordinal: k-1 coefficients have to be estimated for that variable (here,
k = number of categories that the variable has)
, Correlation testing through Multiple Linear Regression
▪ If you have a nominal variable with three categories, you have to add (3-1) two b’s
(dummies) to the formula. Each b represents one of the categories, you randomly choose
which one. The category that is left is basically taken into b0.
Be aware: if they show you R output of a model with nominal/ordinal variables of which you know there
should be more than one coefficient/b, and you only see one coefficient for that variable in the R
coefficients list, that’s what you should point out when the question is “what’s wrong with this stuff?”
• What if there is interaction between two variables? (e.g. research question = “is there an effect of
variable a on the Y variable depending on variable b?” → interaction is between a and b)
o Interaction between two ratio/interval variables: add one extra b
o Interaction between ratio/interval variable and nominal/ordinal variable: add k-1 extra b’s
o Interaction between two nominal/ordinal variables: add ‘(k1 - 1) * (k2 – 1)’ b’s
Example of formula for variables A (ratio), B (nominal, 3 categories) and C (nominal, 3 categories) where there
is interaction between B and C (remember: from 3 categories you only put two in the formula):
Y= b0 + b1A + b2Bcat.1 + b3Bcat.2 + b4Ccat.1 + b5Ccat.2 + b6Bcat.1Ccat.1 + b7Bcat.1Ccat.2 + b8Bcat.2Ccat.1 + b9Bcat.2C
cat.2 → You would actually write it just as ‘b1x1, b2x2, …’, and then after that make a list like “with: x1 = [var name], x2 = [var name], b1 =
[coefficient of the var], b2 = [coefficient of the var]”.
Taking the interaction into account in the formula is called ‘modeling moderation’.
X can be the following in multiple linear regression:
• For interval and ratio variables, X is an actual value
• For nominal and ordinal variables, X is a dummy value (each category of a nominal/ordinal variable has
a dummy value, e.g. X = 1 if member, X = 0 if not a member).
• For interaction terms (variable a x variable b), X is the product of Xa x Xb.
PS: there is only 1 unit change possible in dummy variables → therefore dummy variables always reflect a
group difference on y.
• Assumptions about the residuals of a multiple linear regression model:
o The residuals (and thus observations) are independent
▪ Check in the study design description if independence in the sampling of units is not
likely to be violated. If it is not independent (e.g. picking 20 kids from the same
class), other analyses that account for ‘nested’ data such as multi-level or mixed
models should be used.
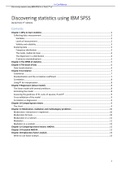
o The residuals are normally distributed with a mean of 0.
▪ Check the Quantile-Quantile (Q-Q) plot if provided, for
indications of extreme deviance (deviance in the tails is
normal). The plot compares the quantiles of the observed data
to the quantiles of the expected distribution.
o There is constant variance / homoscedasticity
▪ Check the scatterplot of residuals by fitted values. Or, check the scatterplot or
boxplots of residuals by interval/ratio variables.
o (variance between data points in the plot of residuals and estimated Y values should be
about the same everywhere).
A multiple linear regression test has several tests that can be performed. For these tests, you should look at the
ANOVA table.
Legenda
- n = sample size
- k = number of estimated regression coefficients (X-variables/predictors)
- SSE = sum of squared errors
- SSYY = total sum of squares
Multiple linear regression test
(statistics → fit models → linear regression)
Simple linear regression: used for testing whether there is a correlation between two variables.
Coefficients / b’s:
• b0 = estimated intercept (estimated value of the dependent variable (Y) when the independent
variable(s) (a.k.a. X-variable, a.k.a. predictor) is zero.
• b1 = estimated coefficient/slope of regression line (change in Y for one-unit change in X).
With B0 and B1, you can determine the expected Y-value (e.g. weight) for a certain X-value (e.g. length), with
the following formula: Yi = b0 + b1 x X1i + ei
- Linear regression works with ‘errors’ (ε) instead of standard deviations. A residual error is the deviation of
a data point / observation from the regression line. The residual standard error (RSE / σε) is basically the
average deviation of data points from the regression line, so it is pretty much similar to standard deviation.
Multiple linear regression: testing for correlation between multiple variables.
Formula:
- b0 = Y-value when all X-values = 0
- Fill in the variable names for the X’s (and if you have more than 1 b for a nominal/ordinal variable, the category
indications as well
• Per variable you have to add a coefficient / b.
o If a variable is ratio or interval: one coefficient has to be estimated for that variable (add one b)
o If a variable is nominal or ordinal: k-1 coefficients have to be estimated for that variable (here,
k = number of categories that the variable has)
, Correlation testing through Multiple Linear Regression
▪ If you have a nominal variable with three categories, you have to add (3-1) two b’s
(dummies) to the formula. Each b represents one of the categories, you randomly choose
which one. The category that is left is basically taken into b0.
Be aware: if they show you R output of a model with nominal/ordinal variables of which you know there
should be more than one coefficient/b, and you only see one coefficient for that variable in the R
coefficients list, that’s what you should point out when the question is “what’s wrong with this stuff?”
• What if there is interaction between two variables? (e.g. research question = “is there an effect of
variable a on the Y variable depending on variable b?” → interaction is between a and b)
o Interaction between two ratio/interval variables: add one extra b
o Interaction between ratio/interval variable and nominal/ordinal variable: add k-1 extra b’s
o Interaction between two nominal/ordinal variables: add ‘(k1 - 1) * (k2 – 1)’ b’s
Example of formula for variables A (ratio), B (nominal, 3 categories) and C (nominal, 3 categories) where there
is interaction between B and C (remember: from 3 categories you only put two in the formula):
Y= b0 + b1A + b2Bcat.1 + b3Bcat.2 + b4Ccat.1 + b5Ccat.2 + b6Bcat.1Ccat.1 + b7Bcat.1Ccat.2 + b8Bcat.2Ccat.1 + b9Bcat.2C
cat.2 → You would actually write it just as ‘b1x1, b2x2, …’, and then after that make a list like “with: x1 = [var name], x2 = [var name], b1 =
[coefficient of the var], b2 = [coefficient of the var]”.
Taking the interaction into account in the formula is called ‘modeling moderation’.
X can be the following in multiple linear regression:
• For interval and ratio variables, X is an actual value
• For nominal and ordinal variables, X is a dummy value (each category of a nominal/ordinal variable has
a dummy value, e.g. X = 1 if member, X = 0 if not a member).
• For interaction terms (variable a x variable b), X is the product of Xa x Xb.
PS: there is only 1 unit change possible in dummy variables → therefore dummy variables always reflect a
group difference on y.
• Assumptions about the residuals of a multiple linear regression model:
o The residuals (and thus observations) are independent
▪ Check in the study design description if independence in the sampling of units is not
likely to be violated. If it is not independent (e.g. picking 20 kids from the same
class), other analyses that account for ‘nested’ data such as multi-level or mixed
models should be used.
o The residuals are normally distributed with a mean of 0.
▪ Check the Quantile-Quantile (Q-Q) plot if provided, for
indications of extreme deviance (deviance in the tails is
normal). The plot compares the quantiles of the observed data
to the quantiles of the expected distribution.
o There is constant variance / homoscedasticity
▪ Check the scatterplot of residuals by fitted values. Or, check the scatterplot or
boxplots of residuals by interval/ratio variables.
o (variance between data points in the plot of residuals and estimated Y values should be
about the same everywhere).
A multiple linear regression test has several tests that can be performed. For these tests, you should look at the
ANOVA table.
Legenda
- n = sample size
- k = number of estimated regression coefficients (X-variables/predictors)
- SSE = sum of squared errors
- SSYY = total sum of squares