MATH143
EXAM 2 REVIEW
Name___________________________________
MULTIPLE CHOICE. Choose the one alternative that best completes the statement or answers the question.
The exercise presents numerical information. Describe the population whose properties are analyzed by the data.
1) There were 558 crimes in a certain city per 100,000 residents. 1)
A) criminals in the country B) residents of the country
C) criminals in the city D) residents of the city
2) 63% of households in City A were online. 2)
A) online households in City A B) online households in the country
C) households in City A D) households in the country
SHORT ANSWER. Write the word or phrase that best completes each statement or answers the question.
Solve the problem.
3) A recent survey revealed that 92% of computer owners in a certain city have access to the 3)
Internet. Describe the population this statement is referring to.
MULTIPLE CHOICE. Choose the one alternative that best completes the statement or answers the question.
4) The government of a town needs to determine if the city's residents will support the construction of 4)
a new town hall. The government decides to conduct a survey of a sample of the city's residents.
Which one of the following procedures would be most appropriate for obtaining a sample of the
town's residents?
A) Survey the first 500 people listed in the town's telephone directory.
B) Survey every 7th person who walks into city hall on a given day.
C) Survey a random sample of persons within each geographic region of the city.
D) Survey a random sample of employees at the old city hall.
5) The city council of a small town needs to determine if the town's residents will support the building 5)
of a new library. The council decides to conduct a survey of a sample of the town's residents. Which
one of the following procedures would be most appropriate for obtaining a sample of the town's
residents?
A) Survey a random sample of persons within each neighborhood of the town.
B) Survey 300 individuals who are randomly selected from a list of all people living in the state
in which the town is located.
C) Survey every 12th person who enters the old library on a given day.
D) Survey a random sample of librarians who live in the town.
SHORT ANSWER. Write the word or phrase that best completes each statement or answers the question.
6) A random sample of 30 high school students is selected. Each student is asked how much 6)
time he or she spent watching television during the previous week. The following times (in
hours) are obtained:
12, 20, 14, 17, 14, 12, 14, 13, 11, 17, 15, 13, 13, 12, 15, 14, 11, 11, 16, 13, 11, 13, 20, 15, 12, 16, 12,
15, 14, 13
Construct a frequency distribution for the data.
1
, MULTIPLE CHOICE. Choose the one alternative that best completes the statement or answers the question.
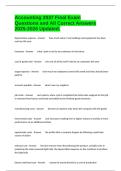
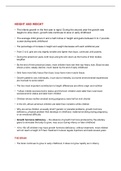
7) Which one of the following is true according to the graph? 7)
A) If the sample is truly representative, then for a group of 50 people, we can expect about 32 of
them to have one year of education beyond high school.
B) The percent of people with years of higher education greater than those shown by any
rectangular bar is equal to the percent of people with years of education less than those
shown by that bar.
C) More people had 4 years of education beyond high school than 3 years.
D) The graph is based on a sample of approximately 62 thousand people.
Find the mean for the group of data items. Round to the nearest hundredth, if necessary.
8) 3, 10, 6, 9, 7, 1, 8, 6 8)
A) 6.29 B) 7.14 C) 6.25 D) 5.5
9) 3.8, 3.1, 6.9, 2, 3.8, 4.4, 3.8, 8.3, 8.3, 4.5 9)
A) 4.13 B) 4.06 C) 5.43 D) 4.89
2
EXAM 2 REVIEW
Name___________________________________
MULTIPLE CHOICE. Choose the one alternative that best completes the statement or answers the question.
The exercise presents numerical information. Describe the population whose properties are analyzed by the data.
1) There were 558 crimes in a certain city per 100,000 residents. 1)
A) criminals in the country B) residents of the country
C) criminals in the city D) residents of the city
2) 63% of households in City A were online. 2)
A) online households in City A B) online households in the country
C) households in City A D) households in the country
SHORT ANSWER. Write the word or phrase that best completes each statement or answers the question.
Solve the problem.
3) A recent survey revealed that 92% of computer owners in a certain city have access to the 3)
Internet. Describe the population this statement is referring to.
MULTIPLE CHOICE. Choose the one alternative that best completes the statement or answers the question.
4) The government of a town needs to determine if the city's residents will support the construction of 4)
a new town hall. The government decides to conduct a survey of a sample of the city's residents.
Which one of the following procedures would be most appropriate for obtaining a sample of the
town's residents?
A) Survey the first 500 people listed in the town's telephone directory.
B) Survey every 7th person who walks into city hall on a given day.
C) Survey a random sample of persons within each geographic region of the city.
D) Survey a random sample of employees at the old city hall.
5) The city council of a small town needs to determine if the town's residents will support the building 5)
of a new library. The council decides to conduct a survey of a sample of the town's residents. Which
one of the following procedures would be most appropriate for obtaining a sample of the town's
residents?
A) Survey a random sample of persons within each neighborhood of the town.
B) Survey 300 individuals who are randomly selected from a list of all people living in the state
in which the town is located.
C) Survey every 12th person who enters the old library on a given day.
D) Survey a random sample of librarians who live in the town.
SHORT ANSWER. Write the word or phrase that best completes each statement or answers the question.
6) A random sample of 30 high school students is selected. Each student is asked how much 6)
time he or she spent watching television during the previous week. The following times (in
hours) are obtained:
12, 20, 14, 17, 14, 12, 14, 13, 11, 17, 15, 13, 13, 12, 15, 14, 11, 11, 16, 13, 11, 13, 20, 15, 12, 16, 12,
15, 14, 13
Construct a frequency distribution for the data.
1
, MULTIPLE CHOICE. Choose the one alternative that best completes the statement or answers the question.
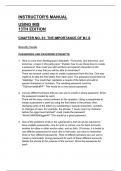
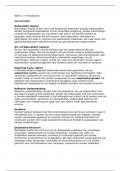
7) Which one of the following is true according to the graph? 7)
A) If the sample is truly representative, then for a group of 50 people, we can expect about 32 of
them to have one year of education beyond high school.
B) The percent of people with years of higher education greater than those shown by any
rectangular bar is equal to the percent of people with years of education less than those
shown by that bar.
C) More people had 4 years of education beyond high school than 3 years.
D) The graph is based on a sample of approximately 62 thousand people.
Find the mean for the group of data items. Round to the nearest hundredth, if necessary.
8) 3, 10, 6, 9, 7, 1, 8, 6 8)
A) 6.29 B) 7.14 C) 6.25 D) 5.5
9) 3.8, 3.1, 6.9, 2, 3.8, 4.4, 3.8, 8.3, 8.3, 4.5 9)
A) 4.13 B) 4.06 C) 5.43 D) 4.89
2