WEEK 1: basic statistics
Statistical inference: a process in which we draw conclusions about populations based on
sample data. The goal is to make generalizations or predictions about a population
parameter using information obtained from a subset of that population (the sample).
Statistical inference involves two main approaches: estimation and hypothesis testing.
Parameters: a numerical characteristic that describes a specific aspect of an entire
population. It is a fixed, often unknown value, used for making predictions or generalizations
about the population based on sample data. (population mean, population standard
deviation).
Levels of measurement:
- Nominal: the data can only be categorized
- Ordinal: the data can be categorized and ranked
- Interval: the data can be categorized, ranked, and evenly spaced
- Ratio: the data can be categorized, ranked, evenly spaced, and has a natural zero.
Law of large numbers: As you increase sample size (or the number of samples), then the
sample mean will approach the population mean.
Central limit theorem: if you take sufficiently large samples from a population, the samples’
means will be normally distributed, even if the population isn’t normally distributed.
Mean: The mean, also known as the average, is calculated by adding up all the values in a
dataset and then dividing by the number of values. The mean is sensitive to extreme values
(outliers) in the dataset
Median: The median is the middle value when a dataset is ordered from smallest to largest.
If there is an even number of observations, the median is the average of the two middle
values. The median is not influenced by extreme values and is especially useful with skewed
distributions.
Mode: The mode is the value that occurs most frequently in a dataset. A dataset may have
one mode (unimodal), two modes (bimodal), or more (multimodal).
Unlike the mean and median, the mode can be applied to categorical data as well.
________________________________________________________________________
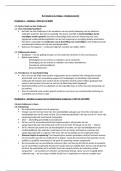
,Right-skewed (positively skewed): The right tail of the distribution is longer than the left tail.
The majority of the data points are concentrated on the left side, and the distribution extends
to the right. In a histogram, it looks like a tail stretching to the right.
Left-skewed (negatively skewed): The left tail of the distribution is longer than the right tail.
The majority of data points are concentrated on the right side, and the distribution extends to
the left. In a histogram, it looks like a tail stretching to the left.
bimodal distribution: has two distinct modes or peaks, indicating that the data has two
prominent groups or patterns.
________________________________________________________________________
NHST: stands for Null Hypothesis Significance Testing. It is a common method used in
statistical inference to assess the evidence against a null hypothesis.
Here's a breakdown of the key components:
- Null Hypothesis (H0): This is a statement of no effect or no difference in the
population. It is often a default assumption that there is no change, no effect, or no
relationship.
- Alternative Hypothesis (H1 or Ha): This is the opposite of the null hypothesis, stating
that there is a significant effect, difference, or relationship in the population.
- Test Statistic: A statistic calculated from the sample data that helps us decide
whether to reject the null hypothesis. A test statistic is a measure of agreement
between your sample data and what is expected under the null hypothesis.
- Significance Level (α): This is the probability of rejecting the null hypothesis when it is
actually true. Commonly used values are 0.05 or 0.01.
- P-value: The probability of obtaining a test statistic as extreme as, or more extreme
than, the one observed in the sample data, assuming the null hypothesis is true.
- Decision Rule: If the p-value is less than the chosen significance level (α), we reject
the null hypothesis in favor of the alternative hypothesis.
-> p < α : reject the null hypothesis
- Conclusion: Based on the decision rule, we make a conclusion about whether there
is enough evidence to reject the null hypothesis and support the alternative
hypothesis.
, Two-tailed tests: used when the alternative hypothesis is non-directional.
- A non-directional hypothesis states that a population parameter (such as a mean or
regression coefficient) is not equal to a certain value (such as 0). Two-tailed tests are
appropriate for most studies.
- If you’re calculating a confidence interval, choose two-tailed.
One-tailed tests: used when the alternative hypothesis is directional.
- A directional hypothesis states that a population parameter is greater than or less
than a certain value.
- Your alternative hypothesis is directional if it includes words such as “greater than,”
“less than,” “increases,” “decreases,” or the “<” or “>” sign. If it doesn’t include these
(or similar), it is probably non-directional.
Confidence intervals:
estimate +/- critical value ⋅ standard error
𝜎
𝑥 ± 𝑧∗ ⋅
𝑛
Type I error: (false-positive) occurs if an investigator rejects a null hypothesis that is actually
true in the population.
Type II error: (false-negative) occurs if the investigator fails to reject a null hypothesis that is
actually false in the population.
________________________________________________________________________
Z-test:
Objective: The objective of a z-test is to determine whether a sample statistic is significantly
different from a known or hypothesized population parameter. This test is commonly used
when the population standard deviation is known, or the sample size is large (>30), allowing
for the use of the standard normal distribution (z-distribution).
Formula:
𝑥−µ
𝑍 = σ
𝑛
𝑥−µ
𝑍 ≈ 𝑠
𝑛
𝑛
2
∑ (𝑥𝑖−𝑥)
𝑖 =1
𝑠 = 𝑛−1
-> Infer from the table the probability of getting this value, or a value larger.
-> p < α : reject the null hypothesis
-> p < α : accept the null hypothesis
Statistical inference: a process in which we draw conclusions about populations based on
sample data. The goal is to make generalizations or predictions about a population
parameter using information obtained from a subset of that population (the sample).
Statistical inference involves two main approaches: estimation and hypothesis testing.
Parameters: a numerical characteristic that describes a specific aspect of an entire
population. It is a fixed, often unknown value, used for making predictions or generalizations
about the population based on sample data. (population mean, population standard
deviation).
Levels of measurement:
- Nominal: the data can only be categorized
- Ordinal: the data can be categorized and ranked
- Interval: the data can be categorized, ranked, and evenly spaced
- Ratio: the data can be categorized, ranked, evenly spaced, and has a natural zero.
Law of large numbers: As you increase sample size (or the number of samples), then the
sample mean will approach the population mean.
Central limit theorem: if you take sufficiently large samples from a population, the samples’
means will be normally distributed, even if the population isn’t normally distributed.
Mean: The mean, also known as the average, is calculated by adding up all the values in a
dataset and then dividing by the number of values. The mean is sensitive to extreme values
(outliers) in the dataset
Median: The median is the middle value when a dataset is ordered from smallest to largest.
If there is an even number of observations, the median is the average of the two middle
values. The median is not influenced by extreme values and is especially useful with skewed
distributions.
Mode: The mode is the value that occurs most frequently in a dataset. A dataset may have
one mode (unimodal), two modes (bimodal), or more (multimodal).
Unlike the mean and median, the mode can be applied to categorical data as well.
________________________________________________________________________
,Right-skewed (positively skewed): The right tail of the distribution is longer than the left tail.
The majority of the data points are concentrated on the left side, and the distribution extends
to the right. In a histogram, it looks like a tail stretching to the right.
Left-skewed (negatively skewed): The left tail of the distribution is longer than the right tail.
The majority of data points are concentrated on the right side, and the distribution extends to
the left. In a histogram, it looks like a tail stretching to the left.
bimodal distribution: has two distinct modes or peaks, indicating that the data has two
prominent groups or patterns.
________________________________________________________________________
NHST: stands for Null Hypothesis Significance Testing. It is a common method used in
statistical inference to assess the evidence against a null hypothesis.
Here's a breakdown of the key components:
- Null Hypothesis (H0): This is a statement of no effect or no difference in the
population. It is often a default assumption that there is no change, no effect, or no
relationship.
- Alternative Hypothesis (H1 or Ha): This is the opposite of the null hypothesis, stating
that there is a significant effect, difference, or relationship in the population.
- Test Statistic: A statistic calculated from the sample data that helps us decide
whether to reject the null hypothesis. A test statistic is a measure of agreement
between your sample data and what is expected under the null hypothesis.
- Significance Level (α): This is the probability of rejecting the null hypothesis when it is
actually true. Commonly used values are 0.05 or 0.01.
- P-value: The probability of obtaining a test statistic as extreme as, or more extreme
than, the one observed in the sample data, assuming the null hypothesis is true.
- Decision Rule: If the p-value is less than the chosen significance level (α), we reject
the null hypothesis in favor of the alternative hypothesis.
-> p < α : reject the null hypothesis
- Conclusion: Based on the decision rule, we make a conclusion about whether there
is enough evidence to reject the null hypothesis and support the alternative
hypothesis.
, Two-tailed tests: used when the alternative hypothesis is non-directional.
- A non-directional hypothesis states that a population parameter (such as a mean or
regression coefficient) is not equal to a certain value (such as 0). Two-tailed tests are
appropriate for most studies.
- If you’re calculating a confidence interval, choose two-tailed.
One-tailed tests: used when the alternative hypothesis is directional.
- A directional hypothesis states that a population parameter is greater than or less
than a certain value.
- Your alternative hypothesis is directional if it includes words such as “greater than,”
“less than,” “increases,” “decreases,” or the “<” or “>” sign. If it doesn’t include these
(or similar), it is probably non-directional.
Confidence intervals:
estimate +/- critical value ⋅ standard error
𝜎
𝑥 ± 𝑧∗ ⋅
𝑛
Type I error: (false-positive) occurs if an investigator rejects a null hypothesis that is actually
true in the population.
Type II error: (false-negative) occurs if the investigator fails to reject a null hypothesis that is
actually false in the population.
________________________________________________________________________
Z-test:
Objective: The objective of a z-test is to determine whether a sample statistic is significantly
different from a known or hypothesized population parameter. This test is commonly used
when the population standard deviation is known, or the sample size is large (>30), allowing
for the use of the standard normal distribution (z-distribution).
Formula:
𝑥−µ
𝑍 = σ
𝑛
𝑥−µ
𝑍 ≈ 𝑠
𝑛
𝑛
2
∑ (𝑥𝑖−𝑥)
𝑖 =1
𝑠 = 𝑛−1
-> Infer from the table the probability of getting this value, or a value larger.
-> p < α : reject the null hypothesis
-> p < α : accept the null hypothesis