Summary Introduction to behavioral research methods
Chapters 3, 9, 10, 11, 12 & 13
Sixth edition
Mark R. Leary
1
,Chapter 3 The measurement of behavior
Types of measures
Measures can be divided into 3 categories:
1. Observational measures
2. Physiological measures
3. Self-reports
Observational measures
This are direct observations of behavior and can be used to measure anything a participant does that
researcher can observe.
Physiological measures
This type of measure is for researchers who are interested in the relationship between bodily
processes ad behavior. Internal processes that are not observable like heart rate, can be measured
with sophisticated equipment.
Self-report measures
This are the replies people give to questionnaires and interviews.
Cognitive self-reports measures what people think about something. Example: attitude
Affective self-reports responses regarding how consumers feel.
Behavioral self-reports participants reports of how they act. Example: how often do you read the
newspaper?
Psychometrics
A specialty which is devoted to the study of psychological measurement. They investigate the
properties of the measure used in behavioral research and work toward improving psychological
measurement.
Scales of measurement
The goal of measurement is to assign numbers to participants’ responses so that they can be
summarized and analyzed.
4 different scales of measurement
1. Nominal
The numbers that are assigned to participants’ behaviors are essentially labels. Example:
boys are 1 and girls are 2. They are rather descriptions than real numbers. They do not have
the properties of real numbers and it does make no sense to perform mathematical
operations on them.
2. Ordinal
Rank ordering of a set of behaviors or characteristics. They tell us the relative order of our
participants on a dimension but do not indicate the distance between participants on the
dimension.
3. Interval
Equal differences between numbers reflect equal difference between participants in the
characteristic being measured. Example: IQ test difference between 90 and 100 is equal to
the difference between 100 and 110. An interval scale does NOT have a true zero point that
indicates the absence of the quality being measured. Example: an IQ score of 0 does not
2
, mean that there is no intelligence. Other examples: temperature. The numbers cannot be
multiplied or divided.
4. Ratio
Ratio scale has a true zero point, those numbers can be added, subtracted, multiplied and
divided. Example: weight etc. Because ratio has a natural zero point, it makes sense to talk
about 100 pounds being twice as heavy as 50 pounds.
Scales of measurement are important for 2 reasons:
1. The measurement scales determines the amount of information provided bya measure
2. The kinds of statistical analyses that can be performed on the data.
Assessing the reliability of a measure
Reliability = the consistency or dependability of a measuring technique. How can be tell whether the
variability in the numbers produced by a measure does reflect the actual variability in the
characteristic or response we want to measure?
Measurement error
A participant’s score consists of two components:
- True score
- Measurement error
Observed core = true score + measurement error.
True score = the score that the participant would have obtained if our measure were perfect and we
were able to measure whatever we are measuring without error.
Measurement error= the result of factors that distort the observed score so that it isn’t precisely
what it should be.
5 categories that can contribute to measurement error:
1. Transient state: Example: mood, health, feelings of anxiety.
2. Stable attributes: example: suspicious participants, less intelligent participants etc. Individual
differences in motivation can affect test scores.
3. Situational factors: example: room temperature, friendly researcher.
4. Characteristics of the measure: example: ambiguous questions, measures that induce fatigue
or fear.
5. Mistakes in recording responses. Example: lose count, typo etc.
The reliability of a measure if an inverse function of measurement error: the more measurement
present in a measuring technique, the less reliable the measure is. Anything that increases
measurement error, decreases the consistency and dependability of the measure
Relationship between measurement error & reliability.
Imagine you want to measure a variable on 5 participants. We want our measure to perfectly capture
the participants’ standing on this variable as shown by their true scores at the left side of the figure.
3
, Reliability as systematic variance
Assessing a measure’s reliability involves an analysis of the variability in a set of scores. If we combine
scores of many participants and calculate the variance, the total variance of the set of scores is
composed of the same two components:
Total variance in a set of scores = variance due to true scores + variance due to measurement error.
The variance that is associated with participants’ true scores is systematic variance.
Reason: the true score component is related in a systematic fashion to the actual attribute that is
measured.
The variance due to measurement error is error variance.
Reason: this variance is not related to the attribute being measured.
Reliability= true score variance / total variance
0 no reliability none of the total variance is true score variance everything is measurement
error totally worthless
1 perfect reliability
4
Chapters 3, 9, 10, 11, 12 & 13
Sixth edition
Mark R. Leary
1
,Chapter 3 The measurement of behavior
Types of measures
Measures can be divided into 3 categories:
1. Observational measures
2. Physiological measures
3. Self-reports
Observational measures
This are direct observations of behavior and can be used to measure anything a participant does that
researcher can observe.
Physiological measures
This type of measure is for researchers who are interested in the relationship between bodily
processes ad behavior. Internal processes that are not observable like heart rate, can be measured
with sophisticated equipment.
Self-report measures
This are the replies people give to questionnaires and interviews.
Cognitive self-reports measures what people think about something. Example: attitude
Affective self-reports responses regarding how consumers feel.
Behavioral self-reports participants reports of how they act. Example: how often do you read the
newspaper?
Psychometrics
A specialty which is devoted to the study of psychological measurement. They investigate the
properties of the measure used in behavioral research and work toward improving psychological
measurement.
Scales of measurement
The goal of measurement is to assign numbers to participants’ responses so that they can be
summarized and analyzed.
4 different scales of measurement
1. Nominal
The numbers that are assigned to participants’ behaviors are essentially labels. Example:
boys are 1 and girls are 2. They are rather descriptions than real numbers. They do not have
the properties of real numbers and it does make no sense to perform mathematical
operations on them.
2. Ordinal
Rank ordering of a set of behaviors or characteristics. They tell us the relative order of our
participants on a dimension but do not indicate the distance between participants on the
dimension.
3. Interval
Equal differences between numbers reflect equal difference between participants in the
characteristic being measured. Example: IQ test difference between 90 and 100 is equal to
the difference between 100 and 110. An interval scale does NOT have a true zero point that
indicates the absence of the quality being measured. Example: an IQ score of 0 does not
2
, mean that there is no intelligence. Other examples: temperature. The numbers cannot be
multiplied or divided.
4. Ratio
Ratio scale has a true zero point, those numbers can be added, subtracted, multiplied and
divided. Example: weight etc. Because ratio has a natural zero point, it makes sense to talk
about 100 pounds being twice as heavy as 50 pounds.
Scales of measurement are important for 2 reasons:
1. The measurement scales determines the amount of information provided bya measure
2. The kinds of statistical analyses that can be performed on the data.
Assessing the reliability of a measure
Reliability = the consistency or dependability of a measuring technique. How can be tell whether the
variability in the numbers produced by a measure does reflect the actual variability in the
characteristic or response we want to measure?
Measurement error
A participant’s score consists of two components:
- True score
- Measurement error
Observed core = true score + measurement error.
True score = the score that the participant would have obtained if our measure were perfect and we
were able to measure whatever we are measuring without error.
Measurement error= the result of factors that distort the observed score so that it isn’t precisely
what it should be.
5 categories that can contribute to measurement error:
1. Transient state: Example: mood, health, feelings of anxiety.
2. Stable attributes: example: suspicious participants, less intelligent participants etc. Individual
differences in motivation can affect test scores.
3. Situational factors: example: room temperature, friendly researcher.
4. Characteristics of the measure: example: ambiguous questions, measures that induce fatigue
or fear.
5. Mistakes in recording responses. Example: lose count, typo etc.
The reliability of a measure if an inverse function of measurement error: the more measurement
present in a measuring technique, the less reliable the measure is. Anything that increases
measurement error, decreases the consistency and dependability of the measure
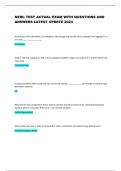
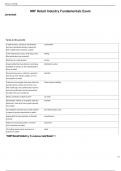
Relationship between measurement error & reliability.
Imagine you want to measure a variable on 5 participants. We want our measure to perfectly capture
the participants’ standing on this variable as shown by their true scores at the left side of the figure.
3
, Reliability as systematic variance
Assessing a measure’s reliability involves an analysis of the variability in a set of scores. If we combine
scores of many participants and calculate the variance, the total variance of the set of scores is
composed of the same two components:
Total variance in a set of scores = variance due to true scores + variance due to measurement error.
The variance that is associated with participants’ true scores is systematic variance.
Reason: the true score component is related in a systematic fashion to the actual attribute that is
measured.
The variance due to measurement error is error variance.
Reason: this variance is not related to the attribute being measured.
Reliability= true score variance / total variance
0 no reliability none of the total variance is true score variance everything is measurement
error totally worthless
1 perfect reliability
4