WGU C955 - Module 6 Correlation & Regression Exam Questions With Correct Answers
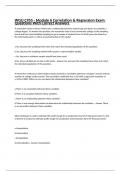
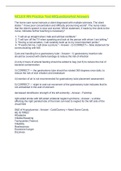
A researcher wants to know if there was a relationship between student age and desire to complete a college degree. To answer this question, the researcher used a local community college as the sampling frame and then used stratified sampling to get a sample of students from 18 to 80 years old. Based on the information given, is there any potential bias in this study? a Yes, because the sampling frame does not match the intended population of the question. b Yes, because the sampling method will not give a representative sample. c Yes, because a voluntary sample should have been used. d No, there will likely be no bias in this study. - Answer Yes, because the sampling frame does not match the intended population of the question. A researcher conducts an observational study and finds a correlation between managers' income and the number of college credits earned. The correlation coefficient was r=.85 with a regression equation of y=515x+12000. What can you say about the relationship between these variables? a There is an association between these variables b There is a causation between these variables. c There is no relationship between these variables. d There is not enough information to determine the relationship between the variables. - Answer There is an association between these variables What technique is used to estimate the profit margin for a production level of 25 thousand units, if a line of best fit is created to estimate profit margin for production levels between 20 to 39 thousand units? a Interpolation b Linearization c Extrapolation d Internalization - Answer Interpolation What is the most appropriate definition of a scatterplot? a A graph that uses dots to demonstrate relationships between two categorical variables. b A graph where lines are shown to represent positive or negative trends. c A graph where the explanatory and response variables are plotted as ordered pairs. d A graph where a positive causation is always represented with dots forming a straight line. - Answer A graph where the explanatory and response variables are plotted as ordered pairs. What does a strong positive correlation between two variables suggest? a The explanatory variable is increasing and the response variable is decreasing b There is an association between the variables c There is a causation between the variables d Cannot determine - Answer There is an association between the variables {{ Scatterplot of distance from city center vs. rent. The linear equation for this scatterplot is y equals negative one hundred five ten thousandths times x plus ten and three hundred eighty one thousandths. }} Using the scatterplot Distance from City Center vs. Monthly Rent, how far can we expect an apartment to be from the city center if the monthly rent is $ 980 ? Round your answer to the nearest mile. a Around 54 miles b Around 55 miles c Around 56 miles d Around 57 miles - Answer Around 55 miles Which correlation coefficient suggests the weakest correlation? a −0.9 b −0.3 c 0.1 d 1 - Answer 0.1 What does it mean for a result or relationship to be statistically significant? a The relationship is not caused by mere chance. b The relationship is caused by chance. c Your hypothesis test has failed. d Your significance level is not high enough. - Answer The relationship is not caused by mere chance. What is the process used to create the equation for the line of best fit? a Completing the square b Least squares estimation c Fitting the line to the curve d Linear approximation - Answer Least squares estimation A relationship between two or more variables is known as a(n) ________. a Causation b Association c Cause and effect d Correlation - Answer Association Using a line of best fit in slope-intercept form, y=mx+b , what must be true if there is a positive correlation? a m must be >0 . b b must be >0 . c Both m and b must be >0 . d Both m and b must have the same sign. - Answer m must be >0. Consider the following equation, y=−3.2x+2.8 . What is the y -intercept for this equation? a −3.2 b 3.2 c 2.8 d −2.8 - Answer 2.8 When linear regression is used to show there is a linear association between two variables, we know the relationship is: a A causation b A correlation c Neither A nor B d Both A and B - Answer A correlation A restaurant owner wants to see if she can use low temperatures to boost soup sales at her restaurant. To study a possible relationship between temperature and soup sales, she collects data throughout the year on the temperature of a given day (ranging between 20 degrees F and 90 degrees F) and the amount of soup sold that day. She performs a linear regression and comes up with a least squares regression line of y=−1.64x+176.6 with r=−0.89 where x is the temperature (in degrees F) and y is the number of daily soup sales. How much soup should she expect to sell on a day that is 50 degrees F? Round to the nearest integer. a 177 orders of soup b 95 orders of soup c 259 orders of soup d 101 orders of soup - Answer 95 orders of soup The line of best fit is also known as: a The extrapolation line b The regression line c The interpolation line d None of the above - Answer The regression line If a trend appears in a large sample of data, the trend may not be replicated if the sample is broken up into smaller subsets. What is this effect known as? a Foster's Theorem b Bayes' Theorem c Simpson's Paradox d Consistency Construct - Answer Simpson's Paradox A variable not included in the study that is related to the measured variables in a study is called a ____________. a Independent variable b Confounding variable c Dependent variable d Lurking variable - Answer Lurking variable Using the scatterplot below, what type of correlation is suggested? Scatterplot displaying data points distributed from lower left to upper right. Points are relatively close to one another. a No correlation b Weak negative positive c Moderate positive d Strong negative - Answer Moderate positive What must be true about the dots on a scatterplot if there is no correlation? a The dots are far away from the line of best fit. b The dots form no recognizable linear pattern. c The dots are evenly spaced around the graph. d The dots form a non-linear pattern. - Answer The dots form no recognizable linear pattern. What is (are) a potential problem(s) that can occur when attempting to use regression analysis? a Extrapolation b Lurking variables c Inappropriate sampling d A, B, and C - Answer A, B, and C A researcher conducts an experimental study and finds a correlation between salary and levels of experience. The correlation coefficient was r=.75 with a regression equation of y=515x+17500 . What can you say about the relationship between these variables? a There is an association between these variables b There is a causation between these variables. c There is no relationship between these variables d There is not enough information to determine the relationship between the variables. - Answer There is a causation between these variables A researcher wants to know if there was a relationship between executive general managers' income and the number of college credits earned. To answer this question, the researcher used a cluster sample to randomly choose 10 states across the United States; then 10 random counties were chosen; then within those 100 total counties, 4 businesses were randomly chosen; all executive general managers working within these 400 total businesses, were then invited to participate in the study. Based on the information given, is there any potential bias in this study?
Written for
- Institution
- WGU C955
- Course
- WGU C955
Document information
- Uploaded on
- January 11, 2024
- Number of pages
- 19
- Written in
- 2023/2024
- Type
- Exam (elaborations)
- Contains
- Questions & answers
Subjects
-
wgu c955 module 6 stuvia
-
wgu c955 module 6 correlation regression exam
-
a researcher wants to know if there was a relation
-
a researcher conducts an observational study and f
Also available in package deal