THEORIE WEEK 1
F-ratio: The F -ratio is the ratio of variance explained by the model to the error in the
model/to the variance that is not explained by the model.
The F-ratio equals the mean square model - that is a measure of the explained
variance by the regression - divided by the mean square error that is a measure of
the variance that remains unexplained by the regression (or else the error variance).
T-test:
The t-test helps to determine the correlation between the response and the predictor
variables.
- Provides some idea of how well a predictor predicts the outcome variable
- The t-statistic tests whether the regression coefficient b, is equal to 0
- The t-statistic can be used to see whether a predictor variable makes a
statistically significant contribution to the regression model
- = regression coefficient / its standard error
- T-test has this hypothesis: Η0: β=0 Η1: β≠0
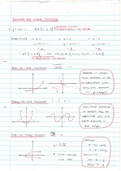
Linear regression:
Simple linear regression equation: Y = a +bX
Y = variable to be predicted
A = intersection of line with y-axis (constant). Expected when x=0
B = slope of the line: how much does y increase if x increases by 1?
Linear regression means that for an increase in the x variable, there will be a
constant change to y.
If there is a perfect linear relationship between x and y, y will fall on a straight line.
Then there is no error in the regression, the residuals are all 0.
Statements about linear regression:
- Linear regression relies on the line of best fit
- Linear regression utilizes a line drawn through the scores where total error is
minimized
- Linear regression seeks to minimize the distance between the regression line
and the scores
- Linear regression helps us discover how much y will change when x changes
Least squares method = a method to find the ‘best fitting’ line, so the straight line
that minimizes the mistake that we make in predicting the Y variable when using the
regression model.
There are positive and negative error, they cancel each other out. So, we add a
square.
Multiple linear regression:
,A multiple linear regression has always only one outcome variable and there can
be more than 2 predictors.
Residuals: the difference between each observation and the model fitted to the data
(all observations)
Residual sum of errors/squares (SSr) the extent to which the regression line
differs from the real data.
R-squared: R-squared is the proportion of variance in the outcome accounted for by
the predictor variable(s). It’s a statistical measure in a regression model that
determines the proportion of variance in the dependent variable that can be
explained by the independent variable. In other words, r-squared shows how well
the data fit the regression model (the goodness of fit).
R2 heeft altijd een waarde tussen 0 en 1, waarbij 1 het best mogelijke model aangeeft
waarbij alle variantie in de afhankelijke variabele verklaard wordt.
ANOVA-table:
Example:
3.030 = the improvement
in the prediction of
depression by fitting the
model
Transform data into a regression equation:
Example The regression equation has the format Y = a + bZ, where Y is the
assessment score and Z is a dummy (0: control group, 1: experimental group)
For the people of the control group, Z=0, the expected value becomes Y = a + b*0 =
a. This expected value is the mean score in the control group, 3.60. So, a=3.60
The slope b is the difference between the expected value (mean) of the experimental
group (3.40) and the expected value of the control group (3.60). Therefore b= -.20.
Thus, the correct answer is Rating = 3.60 - 0.20*EXPGROUP
If a variable is ‘mean-centered’, it’s 0.
, Regression equation of Y with two quantitative independent variables: y = a + b1x1 +
b2x2
Multiple correlation = the correlation between the observed values of the dependent
variable and the predicted scores based on the regression. Measure of how well a
given variable can be predicted.
Proportional reduction in error = the sum of the proportions of explained variance that
each independent variable explains. If we add up the proportions of variance that
each independent variable explains, we reduce the error in the prediction.
F-test = general test in regression. It tests whether the independent variables
together explain a significant part of the variance of Y.
T-statistic:
T = b / SE
Dan kijken of dit groter is dan de kritische waarde (meestal 1.96, soms 1,645). Als
het groter is significant. Kleiner niet significant
When we want to compare the effect of different variables in the same regression, we
use the standardized coefficient (beta).
If x increases with 1 standard deviation then y increases with beta standard
deviations controlling for the other variables. Beta is independent measuring unit!
If we standardize both x and y: mean = 0, SD = 1.
With standardization, the constant is always 0.
F-ratio: The F -ratio is the ratio of variance explained by the model to the error in the
model/to the variance that is not explained by the model.
The F-ratio equals the mean square model - that is a measure of the explained
variance by the regression - divided by the mean square error that is a measure of
the variance that remains unexplained by the regression (or else the error variance).
T-test:
The t-test helps to determine the correlation between the response and the predictor
variables.
- Provides some idea of how well a predictor predicts the outcome variable
- The t-statistic tests whether the regression coefficient b, is equal to 0
- The t-statistic can be used to see whether a predictor variable makes a
statistically significant contribution to the regression model
- = regression coefficient / its standard error
- T-test has this hypothesis: Η0: β=0 Η1: β≠0
Linear regression:
Simple linear regression equation: Y = a +bX
Y = variable to be predicted
A = intersection of line with y-axis (constant). Expected when x=0
B = slope of the line: how much does y increase if x increases by 1?
Linear regression means that for an increase in the x variable, there will be a
constant change to y.
If there is a perfect linear relationship between x and y, y will fall on a straight line.
Then there is no error in the regression, the residuals are all 0.
Statements about linear regression:
- Linear regression relies on the line of best fit
- Linear regression utilizes a line drawn through the scores where total error is
minimized
- Linear regression seeks to minimize the distance between the regression line
and the scores
- Linear regression helps us discover how much y will change when x changes
Least squares method = a method to find the ‘best fitting’ line, so the straight line
that minimizes the mistake that we make in predicting the Y variable when using the
regression model.
There are positive and negative error, they cancel each other out. So, we add a
square.
Multiple linear regression:
,A multiple linear regression has always only one outcome variable and there can
be more than 2 predictors.
Residuals: the difference between each observation and the model fitted to the data
(all observations)
Residual sum of errors/squares (SSr) the extent to which the regression line
differs from the real data.
R-squared: R-squared is the proportion of variance in the outcome accounted for by
the predictor variable(s). It’s a statistical measure in a regression model that
determines the proportion of variance in the dependent variable that can be
explained by the independent variable. In other words, r-squared shows how well
the data fit the regression model (the goodness of fit).
R2 heeft altijd een waarde tussen 0 en 1, waarbij 1 het best mogelijke model aangeeft
waarbij alle variantie in de afhankelijke variabele verklaard wordt.
ANOVA-table:
Example:
3.030 = the improvement
in the prediction of
depression by fitting the
model
Transform data into a regression equation:
Example The regression equation has the format Y = a + bZ, where Y is the
assessment score and Z is a dummy (0: control group, 1: experimental group)
For the people of the control group, Z=0, the expected value becomes Y = a + b*0 =
a. This expected value is the mean score in the control group, 3.60. So, a=3.60
The slope b is the difference between the expected value (mean) of the experimental
group (3.40) and the expected value of the control group (3.60). Therefore b= -.20.
Thus, the correct answer is Rating = 3.60 - 0.20*EXPGROUP
If a variable is ‘mean-centered’, it’s 0.
, Regression equation of Y with two quantitative independent variables: y = a + b1x1 +
b2x2
Multiple correlation = the correlation between the observed values of the dependent
variable and the predicted scores based on the regression. Measure of how well a
given variable can be predicted.
Proportional reduction in error = the sum of the proportions of explained variance that
each independent variable explains. If we add up the proportions of variance that
each independent variable explains, we reduce the error in the prediction.
F-test = general test in regression. It tests whether the independent variables
together explain a significant part of the variance of Y.
T-statistic:
T = b / SE
Dan kijken of dit groter is dan de kritische waarde (meestal 1.96, soms 1,645). Als
het groter is significant. Kleiner niet significant
When we want to compare the effect of different variables in the same regression, we
use the standardized coefficient (beta).
If x increases with 1 standard deviation then y increases with beta standard
deviations controlling for the other variables. Beta is independent measuring unit!
If we standardize both x and y: mean = 0, SD = 1.
With standardization, the constant is always 0.