Week 5: Cellular energy and stress
Assignments thermoregulation
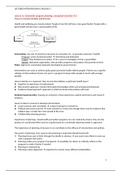
General heat diagram
LCT = lower critical temperature
metabolic rate (heat production) is expected to increase due to a respectively decrease of
the ambient temperature
UCT = upper critical temperature
1 kCal = 4,3 kJ
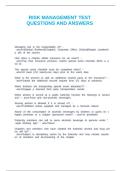
Heat diagram pig
10℃ 2ME feed → only maintenance (2ME)
16-30℃ 2ME feed → 1 ME maintenance + 0,4 ME production (0,6ME into product)
32-40℃ 1 ME → only maintenance (1ME)
Heat diagram human
, General values
- Maintenance requirement /heat production
8,500 – 10,000 kJ/day = 6 - 7 kJ/min
- Heat capacity of the body < 4.2 J/g ℃
- 1 L O2 = 20 kJ, 1 L CO2 = 25 kJ RQ = CO2/O2 → normal diet = 0.8
- RQ of CHO =1, FAT = 0.7, Protein = 0.82
Assignments thermoregulation
General heat diagram
LCT = lower critical temperature
metabolic rate (heat production) is expected to increase due to a respectively decrease of
the ambient temperature
UCT = upper critical temperature
1 kCal = 4,3 kJ
Heat diagram pig
10℃ 2ME feed → only maintenance (2ME)
16-30℃ 2ME feed → 1 ME maintenance + 0,4 ME production (0,6ME into product)
32-40℃ 1 ME → only maintenance (1ME)
Heat diagram human
, General values
- Maintenance requirement /heat production
8,500 – 10,000 kJ/day = 6 - 7 kJ/min
- Heat capacity of the body < 4.2 J/g ℃
- 1 L O2 = 20 kJ, 1 L CO2 = 25 kJ RQ = CO2/O2 → normal diet = 0.8
- RQ of CHO =1, FAT = 0.7, Protein = 0.82