lOMoARcPSD|28965356
Basic EKG Dysrhythmia Identification
Nurisng 3 (Mercy College of Health Sciences)
Studocu is not sponsored or endorsed by any college or university
Downloaded by Wanjiru Gichia ()
, lOMoARcPSD|28965356
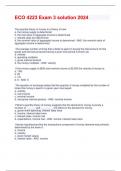
How to Read an EKG Strip
EKG paper is a grid where time is measured along the horizontal axis.
Each small square is 1 mm in length and represents 0.04 seconds.
Each larger square is 5 mm in length and represents 0.2 seconds.
Heart rate can be easily calculated from the EKG strip:
When the rhythm is regular, the heart rate is 300 divided by the number
of large squares between the QRS complexes.
o For example, if there are 4 large squares between regular QRS
complexes, the heart rate is 75 (300/4=75).
The second method can be used with an irregular rhythm to estimate the
rate. Count the number of R waves in a 6 second strip and multiply by
10.
o For example, if there are 7 R waves in a 6 second strip, the heart
rate is 70 (7x10=70).
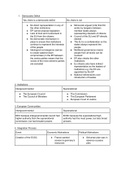
Normal Components of the EKG Waveform
Downloaded by Wanjiru Gichia ()
, lOMoARcPSD|28965356
P wave
Indicates atrial depolarization, or contraction of the atrium.
Normal duration is not longer than 0.11 seconds (less than 3 small
squares)
Amplitude (height) is no more than 3 mm
No notching or peaking
QRS complex
Indicates ventricular depolarization, or contraction of the ventricles.
Normally not longer than .10 seconds in duration
Amplitude is not less than 5 mm in lead II or 9 mm in V3 and V4
R waves are deflected positively and the Q and S waves are negative
T wave
Indicates ventricular repolarization
Not more that 5 mm in amplitude in standard leads and 10 mm in
precordial leads
Rounded and asymmetrical
ST segment
Downloaded by Wanjiru Gichia ()
Basic EKG Dysrhythmia Identification
Nurisng 3 (Mercy College of Health Sciences)
Studocu is not sponsored or endorsed by any college or university
Downloaded by Wanjiru Gichia ()
, lOMoARcPSD|28965356
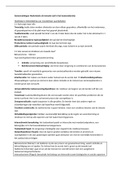
How to Read an EKG Strip
EKG paper is a grid where time is measured along the horizontal axis.
Each small square is 1 mm in length and represents 0.04 seconds.
Each larger square is 5 mm in length and represents 0.2 seconds.
Heart rate can be easily calculated from the EKG strip:
When the rhythm is regular, the heart rate is 300 divided by the number
of large squares between the QRS complexes.
o For example, if there are 4 large squares between regular QRS
complexes, the heart rate is 75 (300/4=75).
The second method can be used with an irregular rhythm to estimate the
rate. Count the number of R waves in a 6 second strip and multiply by
10.
o For example, if there are 7 R waves in a 6 second strip, the heart
rate is 70 (7x10=70).
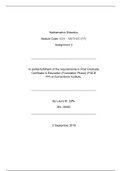
Normal Components of the EKG Waveform
Downloaded by Wanjiru Gichia ()
, lOMoARcPSD|28965356
P wave
Indicates atrial depolarization, or contraction of the atrium.
Normal duration is not longer than 0.11 seconds (less than 3 small
squares)
Amplitude (height) is no more than 3 mm
No notching or peaking
QRS complex
Indicates ventricular depolarization, or contraction of the ventricles.
Normally not longer than .10 seconds in duration
Amplitude is not less than 5 mm in lead II or 9 mm in V3 and V4
R waves are deflected positively and the Q and S waves are negative
T wave
Indicates ventricular repolarization
Not more that 5 mm in amplitude in standard leads and 10 mm in
precordial leads
Rounded and asymmetrical
ST segment
Downloaded by Wanjiru Gichia ()