Video lectures
Lecture 1 Instruction Lecture: Descriptive questions data
Three elements or questions to make up your argumentation:
1. Claim. First what is your decision? The answer is the claim. For example what is the choice for a
technique.
2. Ground. On what data is you decision or conclusion based on. The answer is the ground:
statistical output, type of research questions, measurement levels, etc.
3. Warrant. Why is your choice of your decision adequate given the information you gave. The
answer is the Warrant: general rules, statistical principles.
Purpose of data analysis is to get information in order to answer research questions. You need
numerical answers to answer your research question. You can use two types of numerical methods
for descripting datasets:
1. Frequency table (regardless of measurement level)
2. Measures of central tendency and variability (choice depends on measurement level). Central
tendency and variability are characteristics of a variable to summarize the information.:
a. Central tendency
b. Variability. Or dispersion refer to how the observations or scores are spread around the
measurement of central tendency.
Variance and standard deviation can only be used when a mean is involved.
Empirical rule and chebechevs
There are two ways to interpret the standard deviation and the choice depends on the shape of you
distribution:
1
, Empirical rule. This is when your frequency distribution is symmetric or bell-shaped (normal
distribution).
Chebyshev’s rule. This is when your frequency distribution is not symmetric or bell-shaped (no
normal distribution). So your distribution is skewed. You can’t say anything about the mean- 1
standard deviation.
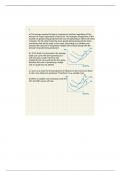
How do you determine the skewness and shape of the distribution?
You use the mean and the median. In this way it is only applicable for interval and ratio variables.
When the mean and median are approximately the same then you have a normal distribution or
symmetric. Negatively skewed means that the mean is lower than the median. Positively skewed
means that the mean is higher than the median.
2
,Lecture 2a Basics on estimation
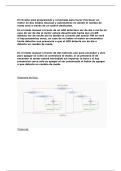
The process of estimating:
1. Determine the population. This is represented in the research question or hypothesis. It contains
all the elements of which we draw conclusions by making generalizations.
2. Draw the sample. This is when the population is too big to examine, you draw a sample.
3. Determine the sample value (X).
4. Estimates and tests by analysis.
When we work with samples we have to establish how confidence we are about the estimations.
Determining and calculating the confidence interval is one way to do this. A confidence interval
refers to a range of scores for which we are in a certain extend confident that it contains the real
population characteristics. The confidence interval is determined by using the features of normal
distribution and the empirical rule. We are allowed to do that because of the central limited
theorem. This theorem says the larger the sample the more the sampling distribution is
approximately normally distributed. Lets say we draw a sample we draw a sample of 100 of a
population of 1000. The composition of this sample can vary for each possible sample of 100 that can
be drawn. Theoretically we can draw many different samples of this population. For each sample we
can calculate the specific characteristic for example the mean. We type each mean in a database and
this will result in a new variable. If our sampling distribution is normally distributed, we know that
the interval of 1.65 times standard deviation to the left and right contains 90% of all sample means.
etc for 95 and 99%. Knowing that we can calculate the interval of confidence around one certain
sample value, and we could also may use of these characteristics to do test or weather or not our
estimations are supported by our data.
Work with the features of sampling distribution we need to know its standard deviation. The
standard deviation of the sampling distribution is called the standard error of the mean. The
sampling distribution is a variable with all possible sample means. We can calculate a mean for all
possible sample means and therefore we can calculate also the standard deviation. The standard
error of the mean is the standard deviation of all possible sample mean. The standard error of the
mean is almost always unknown. And therefore we need to estimate the standard error of the mean.
We do that by using the standard deviation of our own sample and divide this by the square root of
n. So if we have observed a standard deviation of 10 in our data and we have a sample size of 1000.
The estimations is than 10 divided by the square root of 1000.
3
, Lecture 2b Confidence intervals
A confidence interval is the probability that the selected interval encloses the unknown parameter.
You don’t know the real mean for a characteristics of a population. For example the mean age of the
Dutch population. So you are sampling elements of the population to estimate the unknown mean.
Calculating a confidence interval includes two elements:
1. The confidence interval. The probability that the unknown parameter is in that interval.
2. Alpha, α (1 − α). The probability that the random selected interval does not enclose the
unknown parameter. Alpha is the insecurity that the estimated parameter is not in the
confidence interval because of working with the sample. Typical values of alpha are:
a. α=0.01 (1%) confidence level 99%
b. α=0.05 (“)confidence level 95%
c. α=0.10 (“)confidence level 90%
To calculate confidence intervals we use a normal distribution. To determine the probabilities we
need the standard error of the mean (SE). The standard error of the mean is the standard deviation
of all means for all possible samples of the size we work with. We calculate the standard error of the
mean by the standard deviation of our sample divided by the square route of N (look at the red box).
In most cases we do not know the standard deviation of the population. Therefore we use the
standard deviation from our sample. s to estimate the standard deviation of the population and to
calculate the confidence interval. It differs if we work with a large or small sample. When you have a
large sample, the sampling distribution is a normal distribution and so we work with the z value.
When you have a small sample, the sampling distribution are symmetric but slightly different for
4
Lecture 1 Instruction Lecture: Descriptive questions data
Three elements or questions to make up your argumentation:
1. Claim. First what is your decision? The answer is the claim. For example what is the choice for a
technique.
2. Ground. On what data is you decision or conclusion based on. The answer is the ground:
statistical output, type of research questions, measurement levels, etc.
3. Warrant. Why is your choice of your decision adequate given the information you gave. The
answer is the Warrant: general rules, statistical principles.
Purpose of data analysis is to get information in order to answer research questions. You need
numerical answers to answer your research question. You can use two types of numerical methods
for descripting datasets:
1. Frequency table (regardless of measurement level)
2. Measures of central tendency and variability (choice depends on measurement level). Central
tendency and variability are characteristics of a variable to summarize the information.:
a. Central tendency
b. Variability. Or dispersion refer to how the observations or scores are spread around the
measurement of central tendency.
Variance and standard deviation can only be used when a mean is involved.
Empirical rule and chebechevs
There are two ways to interpret the standard deviation and the choice depends on the shape of you
distribution:
1
, Empirical rule. This is when your frequency distribution is symmetric or bell-shaped (normal
distribution).
Chebyshev’s rule. This is when your frequency distribution is not symmetric or bell-shaped (no
normal distribution). So your distribution is skewed. You can’t say anything about the mean- 1
standard deviation.
How do you determine the skewness and shape of the distribution?
You use the mean and the median. In this way it is only applicable for interval and ratio variables.
When the mean and median are approximately the same then you have a normal distribution or
symmetric. Negatively skewed means that the mean is lower than the median. Positively skewed
means that the mean is higher than the median.
2
,Lecture 2a Basics on estimation
The process of estimating:
1. Determine the population. This is represented in the research question or hypothesis. It contains
all the elements of which we draw conclusions by making generalizations.
2. Draw the sample. This is when the population is too big to examine, you draw a sample.
3. Determine the sample value (X).
4. Estimates and tests by analysis.
When we work with samples we have to establish how confidence we are about the estimations.
Determining and calculating the confidence interval is one way to do this. A confidence interval
refers to a range of scores for which we are in a certain extend confident that it contains the real
population characteristics. The confidence interval is determined by using the features of normal
distribution and the empirical rule. We are allowed to do that because of the central limited
theorem. This theorem says the larger the sample the more the sampling distribution is
approximately normally distributed. Lets say we draw a sample we draw a sample of 100 of a
population of 1000. The composition of this sample can vary for each possible sample of 100 that can
be drawn. Theoretically we can draw many different samples of this population. For each sample we
can calculate the specific characteristic for example the mean. We type each mean in a database and
this will result in a new variable. If our sampling distribution is normally distributed, we know that
the interval of 1.65 times standard deviation to the left and right contains 90% of all sample means.
etc for 95 and 99%. Knowing that we can calculate the interval of confidence around one certain
sample value, and we could also may use of these characteristics to do test or weather or not our
estimations are supported by our data.
Work with the features of sampling distribution we need to know its standard deviation. The
standard deviation of the sampling distribution is called the standard error of the mean. The
sampling distribution is a variable with all possible sample means. We can calculate a mean for all
possible sample means and therefore we can calculate also the standard deviation. The standard
error of the mean is the standard deviation of all possible sample mean. The standard error of the
mean is almost always unknown. And therefore we need to estimate the standard error of the mean.
We do that by using the standard deviation of our own sample and divide this by the square root of
n. So if we have observed a standard deviation of 10 in our data and we have a sample size of 1000.
The estimations is than 10 divided by the square root of 1000.
3
, Lecture 2b Confidence intervals
A confidence interval is the probability that the selected interval encloses the unknown parameter.
You don’t know the real mean for a characteristics of a population. For example the mean age of the
Dutch population. So you are sampling elements of the population to estimate the unknown mean.
Calculating a confidence interval includes two elements:
1. The confidence interval. The probability that the unknown parameter is in that interval.
2. Alpha, α (1 − α). The probability that the random selected interval does not enclose the
unknown parameter. Alpha is the insecurity that the estimated parameter is not in the
confidence interval because of working with the sample. Typical values of alpha are:
a. α=0.01 (1%) confidence level 99%
b. α=0.05 (“)confidence level 95%
c. α=0.10 (“)confidence level 90%
To calculate confidence intervals we use a normal distribution. To determine the probabilities we
need the standard error of the mean (SE). The standard error of the mean is the standard deviation
of all means for all possible samples of the size we work with. We calculate the standard error of the
mean by the standard deviation of our sample divided by the square route of N (look at the red box).
In most cases we do not know the standard deviation of the population. Therefore we use the
standard deviation from our sample. s to estimate the standard deviation of the population and to
calculate the confidence interval. It differs if we work with a large or small sample. When you have a
large sample, the sampling distribution is a normal distribution and so we work with the z value.
When you have a small sample, the sampling distribution are symmetric but slightly different for
4