Unit 10 - P5 Kojar Ahmed
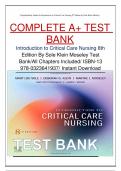
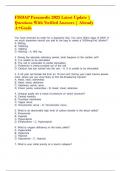
The first question on my questionnaire is
simply to identify the age of the person
answering the question. This graph
shows that the majority of the individuals
who answered my questionnaire were
aged 15-18. This is likely due to the fact I
handed out my questionnaire at the
college where the majority of students
were of this age. The 3% which were
aged 26 – 30 are likely to be teachers
who have filled out the questionnaire.
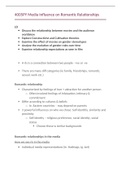
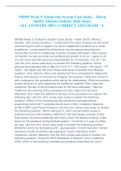
Another question which is still classed as
Q1 is to identify the gender of who’s
answering the questionnaire. This graph
shows 77% of people answering were
male, as opposed to 23% being female.
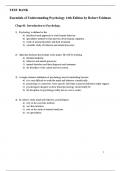
This question shows that the majority of
people buy bottles of water 1-3 times a
week, with a percentage of 48%. The
second most popular percentage, with
29% is once a week. This shows that most
people will buy bottles of water on
occasion or when convenient, rather than
solely relying on bottled water.
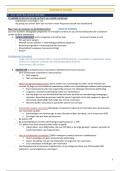
The first question on my questionnaire is
simply to identify the age of the person
answering the question. This graph
shows that the majority of the individuals
who answered my questionnaire were
aged 15-18. This is likely due to the fact I
handed out my questionnaire at the
college where the majority of students
were of this age. The 3% which were
aged 26 – 30 are likely to be teachers
who have filled out the questionnaire.
Another question which is still classed as
Q1 is to identify the gender of who’s
answering the questionnaire. This graph
shows 77% of people answering were
male, as opposed to 23% being female.
This question shows that the majority of
people buy bottles of water 1-3 times a
week, with a percentage of 48%. The
second most popular percentage, with
29% is once a week. This shows that most
people will buy bottles of water on
occasion or when convenient, rather than
solely relying on bottled water.