Statistics & Methodology
summary
In general
- Purpose of statistics: systematize the way we account for uncertainty when making data-
based decisions.
- High variance (high standard deviation) » do not draw conclusions based on Mdif
- Data Scientist: raw information » data analytic techniques » actionable knowledge
- Do not over-state finding, when presenting results » could lead to a waste of time/money
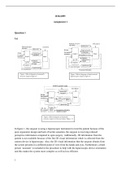
Probability Distributions
- PD’s quantify how likely is each possible value of some
probabilistic entity
- PD’s are re-scaled frequency distributions
- Big population » histogram turns into a continuous
‘smooth’ curve (total area below: 1.0)
Statistical Testing
- Distil information and control for uncertainty; weigh estimated effect by its precision
- Common type of statistical test, Wald Test: T = Estimate / Variability
- Need to compare the test statistics to some objective reference to conduct the test
- This objective reference – sampling distribution – tells us how exceptional our test is.
Sampling Distribution
- SD is simply the probability distribution of a parameter
o Population is defined by infinite sequence of repeated tests
o SD quantifies the possible values of test statistic over infinite repeated sampling
o Each point on curve represents probability of observing corresponding test statistic
- Sampling distribution ≠ random variable distribution
o SD: quantifies possible values of a statistic (mean, t-statistic, correlation coefficient)
o RVD: quantifies possible values of a variable (age, gender, income, food type)
o SD of T-statistic: draw samples repeatedly from RVD, re-compute T each time
- How exceptional is our estimated t-statistic?
o Compare value of SD of t-statistic assuming no effect (null hypothesis)
o When estimated statistic would be very unusual in a population where the null
hypothesis is true, we reject the null and claim a ‘statistically significant’ effect.
- Computing the probability of events
o Area of corresponding slice from the distribution
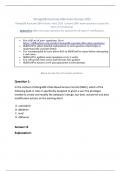
P-values
- Calculating the area in null distribution that exceeds
estimated test statistic (5% » 0.05)
o Compute probability of observing given test statistic (or one more extreme) if null
hypothesis is true.
, o Compute probability of having sampled data we observed (or more unusual data)
from a population wherein there is no true mean difference in ratings.
In R
Conclusions
- A considerate evaluation of uncertainty is crucial to any responsible data analysis.
- Even in situations where you may be analysing the entire ‘population’, you’ll need statistical
inference to make reliable projections of future outcomes.
- For simple questions we can use statistical testing to control for uncertainty!
Statistical Modelling
- Statistical testing quickly reaches a limit
- Real-world ‘messiness’ is controlled through random assignment » knowledge generalisation
- Data scientists normally work with messy observational data instead of conduct experiments
- Model: mathematical representation of data distribution
- ^Y = ^B0 + ^B1*X
, Data Model
- Different than algorithmic model
- Modular model, built from probability distributions
- Encode our hypothesised understanding of the system we’re
exploring
- Constructed in a ‘top-down’ theory-driven way
Regression Problem
- Opposite of classification problems
- Has input (X) and output (Y), involves quantitative response
- Simple mean comparison » regression
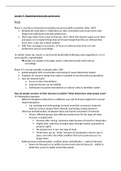
Probability Distribution
- Unconditional (or marginal) distribution:
o Expected value of Y is the same for each observation
- Conditional distribution:
o Expected value of Y for each observation is defined by
observations’ characteristics
Simple Linear Regression
- The best fit line: ^Y = ^B0 + ^B1*X + e
o ^B0 » intercept » expected value Y, when X = 0
o ^B1 » slope » expected change in Y, for X += 1
o e » estimation error » (Y - ^Y)
- Regression coefficients
o Find best fit line
o Most popular: Residual Sum of Squares (RSS)
(Y - ^Y)²
summary
In general
- Purpose of statistics: systematize the way we account for uncertainty when making data-
based decisions.
- High variance (high standard deviation) » do not draw conclusions based on Mdif
- Data Scientist: raw information » data analytic techniques » actionable knowledge
- Do not over-state finding, when presenting results » could lead to a waste of time/money
Probability Distributions
- PD’s quantify how likely is each possible value of some
probabilistic entity
- PD’s are re-scaled frequency distributions
- Big population » histogram turns into a continuous
‘smooth’ curve (total area below: 1.0)
Statistical Testing
- Distil information and control for uncertainty; weigh estimated effect by its precision
- Common type of statistical test, Wald Test: T = Estimate / Variability
- Need to compare the test statistics to some objective reference to conduct the test
- This objective reference – sampling distribution – tells us how exceptional our test is.
Sampling Distribution
- SD is simply the probability distribution of a parameter
o Population is defined by infinite sequence of repeated tests
o SD quantifies the possible values of test statistic over infinite repeated sampling
o Each point on curve represents probability of observing corresponding test statistic
- Sampling distribution ≠ random variable distribution
o SD: quantifies possible values of a statistic (mean, t-statistic, correlation coefficient)
o RVD: quantifies possible values of a variable (age, gender, income, food type)
o SD of T-statistic: draw samples repeatedly from RVD, re-compute T each time
- How exceptional is our estimated t-statistic?
o Compare value of SD of t-statistic assuming no effect (null hypothesis)
o When estimated statistic would be very unusual in a population where the null
hypothesis is true, we reject the null and claim a ‘statistically significant’ effect.
- Computing the probability of events
o Area of corresponding slice from the distribution
P-values
- Calculating the area in null distribution that exceeds
estimated test statistic (5% » 0.05)
o Compute probability of observing given test statistic (or one more extreme) if null
hypothesis is true.
, o Compute probability of having sampled data we observed (or more unusual data)
from a population wherein there is no true mean difference in ratings.
In R
Conclusions
- A considerate evaluation of uncertainty is crucial to any responsible data analysis.
- Even in situations where you may be analysing the entire ‘population’, you’ll need statistical
inference to make reliable projections of future outcomes.
- For simple questions we can use statistical testing to control for uncertainty!
Statistical Modelling
- Statistical testing quickly reaches a limit
- Real-world ‘messiness’ is controlled through random assignment » knowledge generalisation
- Data scientists normally work with messy observational data instead of conduct experiments
- Model: mathematical representation of data distribution
- ^Y = ^B0 + ^B1*X
, Data Model
- Different than algorithmic model
- Modular model, built from probability distributions
- Encode our hypothesised understanding of the system we’re
exploring
- Constructed in a ‘top-down’ theory-driven way
Regression Problem
- Opposite of classification problems
- Has input (X) and output (Y), involves quantitative response
- Simple mean comparison » regression
Probability Distribution
- Unconditional (or marginal) distribution:
o Expected value of Y is the same for each observation
- Conditional distribution:
o Expected value of Y for each observation is defined by
observations’ characteristics
Simple Linear Regression
- The best fit line: ^Y = ^B0 + ^B1*X + e
o ^B0 » intercept » expected value Y, when X = 0
o ^B1 » slope » expected change in Y, for X += 1
o e » estimation error » (Y - ^Y)
- Regression coefficients
o Find best fit line
o Most popular: Residual Sum of Squares (RSS)
(Y - ^Y)²