Inferential statistics
Test 1: 501, 502, 503, 520, 521, 522, 530, 531, 540, 541, 551
501 Confidence interval for a proportion
Key terms:
◼ (standard) normal distribution ◼ Sampling distribution
◼ Empirical rule ◼ Standard error
◼ Statistic ◼ Confidence interval (for the
◼ Parameter proportion)
◼ Population proportion ◼ Margin of error (of proportions)
- Differentiate between statistics and parameters;
- Explain what a sampling distribution is;
- Explain what a sampling distribution of the proportion is
- Know the shape of the sampling distribution of a proportion can be approximated by the
normal distribution
- Know that another word for the standard deviation of the sampling distribution is ‘standard
error’
- Explain how the shape of the sampling distribution of the proportion is related to the
population distribution and the sample size (central limit theorem, standard error decrease);
- Work with the online tool for normal distributions and the 68% - 95% - 99,7% rule
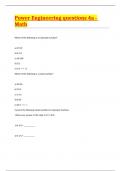
If you want to know how different people in the sample are: standard deviation.
𝑆𝑆 ∑(𝑥𝑖 − 𝑥‾)2
standard deviation = 𝑠 = √𝑠 2 = √ = √
𝑁−1 𝑁−1
(STANDARD)NORMAL DISTRIBUTION
= normal distribution where all values have been standardized. When values have been standardized,
they automatically have a mean of 0 and a standard deviation of 1. This standardization makes it much
easier to look up certain facts about the normal distribution.
The normal distribution
◼ Bell curve
◼ The shape of the normal distribution depends on only two parameters: the mean and the
standard deviation
◼ Normal distributions are symmetric around their mean
◼ The mean, mode and median are always the same
◼ The inflexion points are one standard error away from the mean
◼ 68% of the observed values lies between the two inflexion points
◼ 5% of the observed values lies more than 1.96 standard deviations away from the mean (2.5%
on both sides)
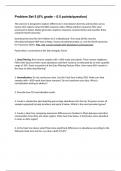
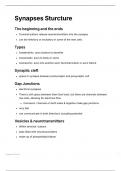
Areas under the normal distribution:
The ‘empirical rule’ (68/95/99.7) is associated with 1, 2 (actually 1.96) and 3 standard deviations.
◼ 68% of the area = within 1 standard deviation
◼ 95% of the area = within 2 standard deviations
◼ 99.7% of the area = within 3 standard deviations
1
, Inferential statistics
Test 1: 501, 502, 503, 520, 521, 522, 530, 531, 540, 541, 551
Central Limit Theorem: says that the sampling distribution of the sample mean will be normally
distributed for infinitely large sample sizes
The standard error
The standard deviation of the sample means is called the standard error, in this case the standard
error of the mean.
= a measure of how uncertain we are about a population mean when we only have sample data to go
on.
- The larger the sample size, the smaller the standard error, the closer a sample mean is expected
to be around the population mean, the more certain we can be about the population mean
- The smaller the standard error, the more confident you can be that your sample mean is close
to the population mean.
Inferential statistics
Descriptive statistics: summarizing data in your sample
Inferential statistics: saying something about the population
2
, Inferential statistics
Test 1: 501, 502, 503, 520, 521, 522, 530, 531, 540, 541, 551
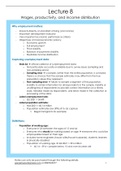
We have a population. We construct a sampling frame from that population. We draw a sample. We
interview in that sample, because not everyone wants to be interviewed and then we have data. We
start with population parameters (describe with Greek letters like μ, σ) and we end with sample
statistics (describe with Latin letters 𝑥̅ , s).
◼ Population parameter = the ‘true’ proportion of people (in the population) being in favor
Let’s assume there are no problems: the population and the sampling frame are identical, everyone
agrees to be interviewed, no missing data and mistakes in the data. We assume a simple random
sample. On the base of that we can draw conclusions using sample statistics, about the population
parameters. If we have problems in the relationship between the population and the sampling frame,
we got bias. If we got problems in the relationship between sample and the interviewed sample, we
got missing data.
- We can ask the question: (to what extent) can we say something about the population on the
basis of a single sample?
Sample statistic, population parameter and random sample
- Suppose you want to know whether the sample is random, and you KNOW something about
the population, you can also use statistics.
- if you know two, you can make statements about the third
Representative sample is not the same as random sample.
- Inferential statistics is based on using RANDOM samples
- Non-representativeness may be an indication that the sample was not random, but it MAY be
that we have a non-representative RANDOM sample
- A simple random sample is not always a perfect reflection of what is going on in the
population
- Simple random samples differ from each other
Summary
- The estimated standard deviation of the sampling distribution is also called the ‘standard
error’
√𝝅∗(𝟏−𝝅)
- The formula for the ‘standard error’ of the proportion is
√𝒏
- The ‘standard deviation’ of a proportion is √𝑝 ∗ (1 − 𝑝)
- The sampling distribution of a proportion is a binomial distribution. However, if the smallest
group is bigger than 5 (or 10), and the sample size is bigger than 30, the normal distribution is
a good approximation of this sampling distribution.
Three different standard deviations.
◼ Populations standard deviation
◼ Standard deviation of the sampling distribution
◼ Sample standard deviation
3
, Inferential statistics
Test 1: 501, 502, 503, 520, 521, 522, 530, 531, 540, 541, 551
Percentages, fractions, proportions
“what is the percentage, fraction, proportion of … ?”
- Percentage: between 0% - 100%
- Fraction: between 0 – 1
- Proportion: between 0 – 1
Proportion = refers to the fraction or percentage of a group that has a certain characteristic or attribute
Notation:
Population proportion: 𝜋 Greek letters for population parameters
Sample proportion: p Latin letters for sample statistics
SAMPLING DISTRIBUTION OF A PROPORTION
- In a large number of samples from a population with 𝜋, of size n, many will have (slightly)
different p’s (a large number of samples size n, will all have different p’s)
- The expected p = 𝜋; the expected sample proportion is identical to the population proportion,
so that is the mean.
- Mean of all proportions = 𝜋 (which is unknown)
The sampling distribution of a proportion is a binomial distribution. However, if the smallest group
is bigger than 5 (or 10) and the sample size is bigger than 30, the normal distribution is a good
approximation of this sampling distribution.
- Its shape is formally a binomial distribution, but the shape is very similar to the normal
distribution.
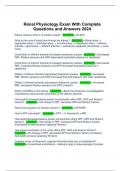
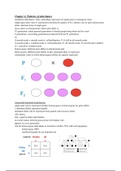
Example: a random sample of 60, and a sample proportion of 12% is in favor
It seems like the smallest of the two groups consists of about 7 cases (60/100 * 12) which is less than
10. It is therefore not appropriate to use the normal approximation for the sampling distribution of the
sample proportion.
It is different in at least two respects from a normal distribution:
1. Some values are impossible, for example, if the sample size is 30, a percentage can never be
exactly 7.5%, because 22,5% observations being in favor is impossible. The normal
distribution is continuous.
2. Values (the proportions) can NEVER be smaller than 0 or bigger than 1 (100 percent), while a
normal distribution has an infinite x-scale (the normal distribution extents indefinitely)
The (estimate of the) standard deviation of the sampling distribution, a.k.a. the standard error:
- s.e. depends on the sample size n and on 𝜋 (or rather on the standard deviation of the
population distribution)
√𝝅∗(𝟏−𝝅)
𝒔. 𝒆. =
√𝒏
◼ Sample size: bigger sample size would decrease the standard deviation of the sampling
distribution. Smaller samples would give a bigger standard deviation of the sampling
distribution.
4
Test 1: 501, 502, 503, 520, 521, 522, 530, 531, 540, 541, 551
501 Confidence interval for a proportion
Key terms:
◼ (standard) normal distribution ◼ Sampling distribution
◼ Empirical rule ◼ Standard error
◼ Statistic ◼ Confidence interval (for the
◼ Parameter proportion)
◼ Population proportion ◼ Margin of error (of proportions)
- Differentiate between statistics and parameters;
- Explain what a sampling distribution is;
- Explain what a sampling distribution of the proportion is
- Know the shape of the sampling distribution of a proportion can be approximated by the
normal distribution
- Know that another word for the standard deviation of the sampling distribution is ‘standard
error’
- Explain how the shape of the sampling distribution of the proportion is related to the
population distribution and the sample size (central limit theorem, standard error decrease);
- Work with the online tool for normal distributions and the 68% - 95% - 99,7% rule
If you want to know how different people in the sample are: standard deviation.
𝑆𝑆 ∑(𝑥𝑖 − 𝑥‾)2
standard deviation = 𝑠 = √𝑠 2 = √ = √
𝑁−1 𝑁−1
(STANDARD)NORMAL DISTRIBUTION
= normal distribution where all values have been standardized. When values have been standardized,
they automatically have a mean of 0 and a standard deviation of 1. This standardization makes it much
easier to look up certain facts about the normal distribution.
The normal distribution
◼ Bell curve
◼ The shape of the normal distribution depends on only two parameters: the mean and the
standard deviation
◼ Normal distributions are symmetric around their mean
◼ The mean, mode and median are always the same
◼ The inflexion points are one standard error away from the mean
◼ 68% of the observed values lies between the two inflexion points
◼ 5% of the observed values lies more than 1.96 standard deviations away from the mean (2.5%
on both sides)
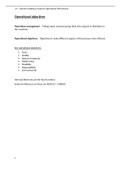
Areas under the normal distribution:
The ‘empirical rule’ (68/95/99.7) is associated with 1, 2 (actually 1.96) and 3 standard deviations.
◼ 68% of the area = within 1 standard deviation
◼ 95% of the area = within 2 standard deviations
◼ 99.7% of the area = within 3 standard deviations
1
, Inferential statistics
Test 1: 501, 502, 503, 520, 521, 522, 530, 531, 540, 541, 551
Central Limit Theorem: says that the sampling distribution of the sample mean will be normally
distributed for infinitely large sample sizes
The standard error
The standard deviation of the sample means is called the standard error, in this case the standard
error of the mean.
= a measure of how uncertain we are about a population mean when we only have sample data to go
on.
- The larger the sample size, the smaller the standard error, the closer a sample mean is expected
to be around the population mean, the more certain we can be about the population mean
- The smaller the standard error, the more confident you can be that your sample mean is close
to the population mean.
Inferential statistics
Descriptive statistics: summarizing data in your sample
Inferential statistics: saying something about the population
2
, Inferential statistics
Test 1: 501, 502, 503, 520, 521, 522, 530, 531, 540, 541, 551
We have a population. We construct a sampling frame from that population. We draw a sample. We
interview in that sample, because not everyone wants to be interviewed and then we have data. We
start with population parameters (describe with Greek letters like μ, σ) and we end with sample
statistics (describe with Latin letters 𝑥̅ , s).
◼ Population parameter = the ‘true’ proportion of people (in the population) being in favor
Let’s assume there are no problems: the population and the sampling frame are identical, everyone
agrees to be interviewed, no missing data and mistakes in the data. We assume a simple random
sample. On the base of that we can draw conclusions using sample statistics, about the population
parameters. If we have problems in the relationship between the population and the sampling frame,
we got bias. If we got problems in the relationship between sample and the interviewed sample, we
got missing data.
- We can ask the question: (to what extent) can we say something about the population on the
basis of a single sample?
Sample statistic, population parameter and random sample
- Suppose you want to know whether the sample is random, and you KNOW something about
the population, you can also use statistics.
- if you know two, you can make statements about the third
Representative sample is not the same as random sample.
- Inferential statistics is based on using RANDOM samples
- Non-representativeness may be an indication that the sample was not random, but it MAY be
that we have a non-representative RANDOM sample
- A simple random sample is not always a perfect reflection of what is going on in the
population
- Simple random samples differ from each other
Summary
- The estimated standard deviation of the sampling distribution is also called the ‘standard
error’
√𝝅∗(𝟏−𝝅)
- The formula for the ‘standard error’ of the proportion is
√𝒏
- The ‘standard deviation’ of a proportion is √𝑝 ∗ (1 − 𝑝)
- The sampling distribution of a proportion is a binomial distribution. However, if the smallest
group is bigger than 5 (or 10), and the sample size is bigger than 30, the normal distribution is
a good approximation of this sampling distribution.
Three different standard deviations.
◼ Populations standard deviation
◼ Standard deviation of the sampling distribution
◼ Sample standard deviation
3
, Inferential statistics
Test 1: 501, 502, 503, 520, 521, 522, 530, 531, 540, 541, 551
Percentages, fractions, proportions
“what is the percentage, fraction, proportion of … ?”
- Percentage: between 0% - 100%
- Fraction: between 0 – 1
- Proportion: between 0 – 1
Proportion = refers to the fraction or percentage of a group that has a certain characteristic or attribute
Notation:
Population proportion: 𝜋 Greek letters for population parameters
Sample proportion: p Latin letters for sample statistics
SAMPLING DISTRIBUTION OF A PROPORTION
- In a large number of samples from a population with 𝜋, of size n, many will have (slightly)
different p’s (a large number of samples size n, will all have different p’s)
- The expected p = 𝜋; the expected sample proportion is identical to the population proportion,
so that is the mean.
- Mean of all proportions = 𝜋 (which is unknown)
The sampling distribution of a proportion is a binomial distribution. However, if the smallest group
is bigger than 5 (or 10) and the sample size is bigger than 30, the normal distribution is a good
approximation of this sampling distribution.
- Its shape is formally a binomial distribution, but the shape is very similar to the normal
distribution.
Example: a random sample of 60, and a sample proportion of 12% is in favor
It seems like the smallest of the two groups consists of about 7 cases (60/100 * 12) which is less than
10. It is therefore not appropriate to use the normal approximation for the sampling distribution of the
sample proportion.
It is different in at least two respects from a normal distribution:
1. Some values are impossible, for example, if the sample size is 30, a percentage can never be
exactly 7.5%, because 22,5% observations being in favor is impossible. The normal
distribution is continuous.
2. Values (the proportions) can NEVER be smaller than 0 or bigger than 1 (100 percent), while a
normal distribution has an infinite x-scale (the normal distribution extents indefinitely)
The (estimate of the) standard deviation of the sampling distribution, a.k.a. the standard error:
- s.e. depends on the sample size n and on 𝜋 (or rather on the standard deviation of the
population distribution)
√𝝅∗(𝟏−𝝅)
𝒔. 𝒆. =
√𝒏
◼ Sample size: bigger sample size would decrease the standard deviation of the sampling
distribution. Smaller samples would give a bigger standard deviation of the sampling
distribution.
4