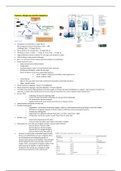
DATA
Data Frame
case for / ray
✗ ✗
Data Types
Cathegorical
Verbal # clear text # name
coded # coded # id #number
Numerical
Discrete #number # 7-
Continuous #number # IR
Measurement Level
Nominal Data
Ordinal Data #natural order #counting /order
Interval Data 11 # meaningful scale differences #sums/differences
Ratio Data 11 # absolute scale #any math operations
^
, DATA
coding
Replacement of nominal and ordinal cathegori.es by numbers
factor (variable -
)
name
Missing Cases
Deletion # delete case
lmpufion (type average) #use average value of type
Impulsion (average) # use average value
Population & Sample
amPk
all possible data points Pop
→
.
# random
3
Sample #subset
infer sfh about Pop
. .
# different possible
outcomes
statistical Analysis
Model #theory #possible outcome
Observed Data Points # comparison with possible outcome
# reject/ confirm theory
2
, DATA
Population & Sample
Data Summary
Numbers
Proportion
/
Cases Cases
* =
p=
N n
proportion proportion p
Pop .
Size N Sample size h
Mean
n
* I E- I
!É "
Weighted Sample Mean
I
=F for
Pjxj c classes , proportions p outcomes ✗
⇐
,
g.
Median
M= 2- In +1) th ranked observation
3
, DATA
Population & Sample
Data Summary
Numbers
Percentiles
( ntl )
9p% =p tooth ranked observation
① =
925% , ①2=950%1 ①3=975?
Geometric Mean
'
C- =Yxxn
ki trimmed
-
mean
#disregarding highest ,
lowest K! observations
Minimum / Maximum observation
hid -
Range #average of Max .
and min .
4