1.1. Descriptive statistics
In tutorial 1, we calculated descriptive statistics for samples (including central tendency and variability estimates such
as the mean and standard deviation).
A sample refers to the group of observations drawn from the total population of interest (e.g. a sample of 72 female
anorexic patients were studied out of the nation-wide hospital registry of female anorexic patients)
Descriptive statistics allow us to summarise the characteristics of a sample
1.2. Inferential statistics
Unlike descriptive statistics, inferential statistics are calculated
with respect to the population.
A population includes all possible elements (e.g. the entire female
anorexia patient hospital registry)
Inferential statistics allow us to characterise a population.
One does not always have access to an entire population, but
probability theory can be used to infer characteristics about a
population
2. What is probability?
Probability can be defined in 2 ways:
1. Probabilty as the likelihood of occurrence of random events - referred to as theoretical probability
o Refers to what we expect to happen
o Expressed as a theoretical probability (e.g. 0.5)
o For example: in a random fair coin toss, there is a 0.5 probability of obtaining tails.
2. Probability as the frequency of occurrence - known as empirical probability
o Refers to what we find out through observation
o Typically expressed as a percentage (e.g. 20%), proportion (e.g. 0.2) or fraction (e.g. 2000/10000)
o For example: 2000 out of 10000 randomly sampled individuals from the population are HIV-positive,
suggesting that there is a 20% chance that any randomly chosen individual is HIV-positive
Probability formula: P(E) = number of outcomes of interest
Total number of outcomes
NB When we traditionally speak about probability, we represent it as any value ranging between (and including) 0
and 1
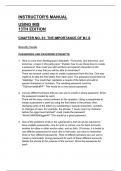
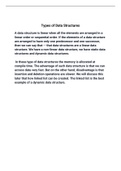
2.1. Probability example using smarties
Smartie colours This particular box of smarties consists of the following:
, Smartie colour Number of smarties
PINK 14
RED 6
YELLOW 5
BLUE 6
BROWN 4
ORANGE 2
GREEN 4
TOTAL 41
2.2.1. Mutually exclusive events
Two or more events are mutually exclusive when they cannot occur at the same time.
1. Some examples (events that cannot occur at the same time):
o If turning left or right in a car are possible events, they are mutually exclusive because one cannot
turn both left and right at the same time (i.e. simultaneously).
o Kings and aces in a deck of cards
o Heads and tails on a coin
2.2.2. Exhaustive events
Events are exhaustive if they encompass the entire range of possible outcomes. The probabilities of all possible
events sum to 1
1. Some examples:
o values 1,2,3,4,5,6 on a die are exhaustive of all possible values that can be obtained on a dice (i.e. no
other value is possible on a die)
o 7 continents on earth (not, say, 5 or 6)
2.2.3. “NOT” rule
The probability of a event NOT occurring is equal to 1-probability of event occuring
NOT rule probability formula: P(NOTEvent) = 1−P(Event)
Exercise 2.2.3.1
What is the probability that a randomly chosen smartie is NOT BLUE? (Use code chunk below)
Hint: 1- P(BLUE)
In tutorial 1, we calculated descriptive statistics for samples (including central tendency and variability estimates such
as the mean and standard deviation).
A sample refers to the group of observations drawn from the total population of interest (e.g. a sample of 72 female
anorexic patients were studied out of the nation-wide hospital registry of female anorexic patients)
Descriptive statistics allow us to summarise the characteristics of a sample
1.2. Inferential statistics
Unlike descriptive statistics, inferential statistics are calculated
with respect to the population.
A population includes all possible elements (e.g. the entire female
anorexia patient hospital registry)
Inferential statistics allow us to characterise a population.
One does not always have access to an entire population, but
probability theory can be used to infer characteristics about a
population
2. What is probability?
Probability can be defined in 2 ways:
1. Probabilty as the likelihood of occurrence of random events - referred to as theoretical probability
o Refers to what we expect to happen
o Expressed as a theoretical probability (e.g. 0.5)
o For example: in a random fair coin toss, there is a 0.5 probability of obtaining tails.
2. Probability as the frequency of occurrence - known as empirical probability
o Refers to what we find out through observation
o Typically expressed as a percentage (e.g. 20%), proportion (e.g. 0.2) or fraction (e.g. 2000/10000)
o For example: 2000 out of 10000 randomly sampled individuals from the population are HIV-positive,
suggesting that there is a 20% chance that any randomly chosen individual is HIV-positive
Probability formula: P(E) = number of outcomes of interest
Total number of outcomes
NB When we traditionally speak about probability, we represent it as any value ranging between (and including) 0
and 1
2.1. Probability example using smarties
Smartie colours This particular box of smarties consists of the following:
, Smartie colour Number of smarties
PINK 14
RED 6
YELLOW 5
BLUE 6
BROWN 4
ORANGE 2
GREEN 4
TOTAL 41
2.2.1. Mutually exclusive events
Two or more events are mutually exclusive when they cannot occur at the same time.
1. Some examples (events that cannot occur at the same time):
o If turning left or right in a car are possible events, they are mutually exclusive because one cannot
turn both left and right at the same time (i.e. simultaneously).
o Kings and aces in a deck of cards
o Heads and tails on a coin
2.2.2. Exhaustive events
Events are exhaustive if they encompass the entire range of possible outcomes. The probabilities of all possible
events sum to 1
1. Some examples:
o values 1,2,3,4,5,6 on a die are exhaustive of all possible values that can be obtained on a dice (i.e. no
other value is possible on a die)
o 7 continents on earth (not, say, 5 or 6)
2.2.3. “NOT” rule
The probability of a event NOT occurring is equal to 1-probability of event occuring
NOT rule probability formula: P(NOTEvent) = 1−P(Event)
Exercise 2.2.3.1
What is the probability that a randomly chosen smartie is NOT BLUE? (Use code chunk below)
Hint: 1- P(BLUE)