BA 584 HW 5 - Control Charts and Process Capability
Unit Codes
Institutional Affiliation
Dates
Page 1 of 21
, BA 584 HW 5 - Control Charts and Process Capability
Your Name:
Problem 1. Cleaning Requests.
A Six Sigma team at a large hotel collected data on the number of special cleaning service requests made daily.
The team wondered if the number of requests varied by the day of the week or when many conference rooms
were booked. They recorded the number of special requests each day for 50 days.
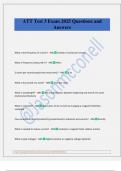
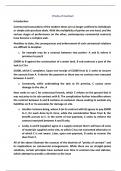
Here are the summary statistics and histogram for cleaning requests:
Statistics
Variable N N Mean SE StDev Minimum Q1 Median Q3 Maximum
Mean
Requests 50 0 14.320 0.577 4.078 5.000 11.000 14.000 17.250 24.000
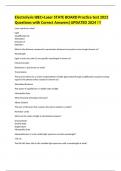
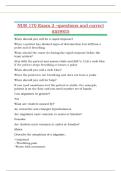
This is the U control chart for the requests:
Page 2 of 21
, Answer these questions using the information above.
A. Using the summary statistics and visual inspection of the histogram, what is the typical number of special
requests made daily? Include the measurement units in your response.
Based on the summary statistics and a thorough examination of the histogram, we can ascertain the customary
quantity of exceptional appeals made daily. Please include the relevant units of measurement in your reply. The
familiar figure of special requests made each day can be deduced from the data's average. Per the summary
statistics, the average (mean) number of special appeals made daily stands at 14.320. The unit of measurement
for this value is "requests per day."
B. Based on the Minitab control chart, is the process stable? Why or why not?
To ascertain the stability of the procedure, an analysis of the control chart is necessary. Ordinarily, when
inspecting a control chart, one would seek out the subsequent indications of stability: Data points fall within the
confines of the control limits (signified by the UCL and LCL). Additionally, it is imperative to note that no
conspicuous patterns or trends are discernible. This would indicate a stable process. Furthermore, the absence of
Page 3 of 21
Unit Codes
Institutional Affiliation
Dates
Page 1 of 21
, BA 584 HW 5 - Control Charts and Process Capability
Your Name:
Problem 1. Cleaning Requests.
A Six Sigma team at a large hotel collected data on the number of special cleaning service requests made daily.
The team wondered if the number of requests varied by the day of the week or when many conference rooms
were booked. They recorded the number of special requests each day for 50 days.
Here are the summary statistics and histogram for cleaning requests:
Statistics
Variable N N Mean SE StDev Minimum Q1 Median Q3 Maximum
Mean
Requests 50 0 14.320 0.577 4.078 5.000 11.000 14.000 17.250 24.000
This is the U control chart for the requests:
Page 2 of 21
, Answer these questions using the information above.
A. Using the summary statistics and visual inspection of the histogram, what is the typical number of special
requests made daily? Include the measurement units in your response.
Based on the summary statistics and a thorough examination of the histogram, we can ascertain the customary
quantity of exceptional appeals made daily. Please include the relevant units of measurement in your reply. The
familiar figure of special requests made each day can be deduced from the data's average. Per the summary
statistics, the average (mean) number of special appeals made daily stands at 14.320. The unit of measurement
for this value is "requests per day."
B. Based on the Minitab control chart, is the process stable? Why or why not?
To ascertain the stability of the procedure, an analysis of the control chart is necessary. Ordinarily, when
inspecting a control chart, one would seek out the subsequent indications of stability: Data points fall within the
confines of the control limits (signified by the UCL and LCL). Additionally, it is imperative to note that no
conspicuous patterns or trends are discernible. This would indicate a stable process. Furthermore, the absence of
Page 3 of 21