WGU C955 Applied Probability and Statistics
Objective Assessment Exam
Questions and Revised Answers, 100% Guarantee Pass
This test consisting of 70 multiple-choice ques with Ans
1. A new video gaming site wants to know what the median age is of its
adolescent population so they can focus on activities for these clients. A data
analyst recorded the ages of 12 adolescents who used the sit over a three-month
period. The results are given below:
Age Frequency 13 1
16 2
17 2
18 3
19 4
What is the median age of the adolescents? a) 17.0
b) 17.2
c) 18.0
d) 18.6: 18.0
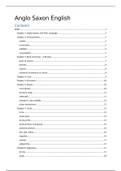
,2. The graph shows a company's profits, in thousands of dollars, for five different
regions:
A: 28
B: 32
C: 15
D: 40
E: 23
Based on this graph, what is the closest approximate total profit (in thousands) for all five
regions?
a) 100
b) 140
c) 170
d) 200: 140
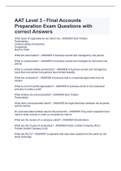
3. The bar chart below summarizes the final grade distribution for a statistics course:
A: 5
B: 9
C: 11
D: 8
F: 7
Which percentage of students earned a B in the statistics course?
a) 9%
b) 22.5%
,c) 27.5%
d) 40%: 22.5%
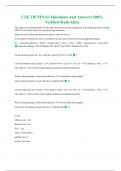
4. Which statement is true regarding the distribution of the histogram below? (skewed
left)
a) the means of the distribution is greater than its median
b) the median of the distribution is greater than its mean
c) the mean and the median of the distribution are equal
d) the relationship between the mean and the median cannot be determined from
the histogram
: the mean of the distribution is greater than its median
5. In one 12-hour shift, a nurse spends four hours at patient bedsides, two hours
pulling medications, one hour on breaks, two hours documenting, and three hours
doing other activities. An analyst would like to display the data by representing the 12-
hour shift as one whole.
Which display method should the analyst use to meet this goal?
a) box plot
b) stem plot
c) histogram
d) pie chart: pie chart
,6. For which type of website data would a histogram be most appropriate?
a) length of visit in minutes
b) location of visitor by country
c) frequently viewed pages
d) most popular method of arrival:
length of visit in minutes
7. A company has 14 employees. Six employees work day shift, five employ- ees work
swing shift, and three employees work night shift.
Which type of graph should be used to display how many employees work each shift?
a) stem plot
b) bar graph
c) box plot
d) histogram: bar graph
8. The bar chart below displays the daily number of visits for the five most
frequently viewed web pages of retailer's website:
Why is this chart an inaccurate representation of the data?
a) the horizontal labels are missing
b) a histogram instead of a bar chart should be used for this type of data
,c) a pie chart instead of a bar chart should be used for this type of data
d) the vertical axis should start at 600 instead of 0 based on this data.
: the horizontal labels are missing
9. Two employees, Smith and Jones, had first quarterly sales of $50,000 and
$60,000, respectively. The graph below depicts this information.
What is true about this graph's depiction of the data?
a) the graph reflects the results perfectly
b) the graph misrepresents the data by starting the vertical axis at 40, making it seem
that Jones had twice Smith's sales
c) the graph misrepresents the data by using different colors for the bars that show
Smith's and Jones's sales
d) the graph misrepresents the data by including values on the vertical axis as high as
100 when neither Smith nor Jones had sales that high
: The graph misrepresents the data by starting the vertical axis at 40, making it seem that
Jones had twice Smith's sales
10. The chart below shows the population of Texas from 1900 through 2000 (in millions
of people):
Why is this graph a misleading representation of this data?
a) rounding to the nearest million distorts the true values
b) the horizontal scale is uneven
, c) the vertical scale is uneven
d) the x-axis and y-axis should be reversed
: the a-axis and y-axis should be reversed
11. A study was conducted to see if blood type influenced height?
Which type of classification is this?
a) categorical to categorical
b) categorical to quantitative
c) quantitative to quantitative
d) quantitative to categorical
: categorical to quantitative
12. A study was conducted on the possible relationship between smoking status
and whether or not alcohol is consumed?
Which type of classification is this?
a) categorical to categorical
b) quantitative to categorical
Objective Assessment Exam
Questions and Revised Answers, 100% Guarantee Pass
This test consisting of 70 multiple-choice ques with Ans
1. A new video gaming site wants to know what the median age is of its
adolescent population so they can focus on activities for these clients. A data
analyst recorded the ages of 12 adolescents who used the sit over a three-month
period. The results are given below:
Age Frequency 13 1
16 2
17 2
18 3
19 4
What is the median age of the adolescents? a) 17.0
b) 17.2
c) 18.0
d) 18.6: 18.0
,2. The graph shows a company's profits, in thousands of dollars, for five different
regions:
A: 28
B: 32
C: 15
D: 40
E: 23
Based on this graph, what is the closest approximate total profit (in thousands) for all five
regions?
a) 100
b) 140
c) 170
d) 200: 140
3. The bar chart below summarizes the final grade distribution for a statistics course:
A: 5
B: 9
C: 11
D: 8
F: 7
Which percentage of students earned a B in the statistics course?
a) 9%
b) 22.5%
,c) 27.5%
d) 40%: 22.5%
4. Which statement is true regarding the distribution of the histogram below? (skewed
left)
a) the means of the distribution is greater than its median
b) the median of the distribution is greater than its mean
c) the mean and the median of the distribution are equal
d) the relationship between the mean and the median cannot be determined from
the histogram
: the mean of the distribution is greater than its median
5. In one 12-hour shift, a nurse spends four hours at patient bedsides, two hours
pulling medications, one hour on breaks, two hours documenting, and three hours
doing other activities. An analyst would like to display the data by representing the 12-
hour shift as one whole.
Which display method should the analyst use to meet this goal?
a) box plot
b) stem plot
c) histogram
d) pie chart: pie chart
,6. For which type of website data would a histogram be most appropriate?
a) length of visit in minutes
b) location of visitor by country
c) frequently viewed pages
d) most popular method of arrival:
length of visit in minutes
7. A company has 14 employees. Six employees work day shift, five employ- ees work
swing shift, and three employees work night shift.
Which type of graph should be used to display how many employees work each shift?
a) stem plot
b) bar graph
c) box plot
d) histogram: bar graph
8. The bar chart below displays the daily number of visits for the five most
frequently viewed web pages of retailer's website:
Why is this chart an inaccurate representation of the data?
a) the horizontal labels are missing
b) a histogram instead of a bar chart should be used for this type of data
,c) a pie chart instead of a bar chart should be used for this type of data
d) the vertical axis should start at 600 instead of 0 based on this data.
: the horizontal labels are missing
9. Two employees, Smith and Jones, had first quarterly sales of $50,000 and
$60,000, respectively. The graph below depicts this information.
What is true about this graph's depiction of the data?
a) the graph reflects the results perfectly
b) the graph misrepresents the data by starting the vertical axis at 40, making it seem
that Jones had twice Smith's sales
c) the graph misrepresents the data by using different colors for the bars that show
Smith's and Jones's sales
d) the graph misrepresents the data by including values on the vertical axis as high as
100 when neither Smith nor Jones had sales that high
: The graph misrepresents the data by starting the vertical axis at 40, making it seem that
Jones had twice Smith's sales
10. The chart below shows the population of Texas from 1900 through 2000 (in millions
of people):
Why is this graph a misleading representation of this data?
a) rounding to the nearest million distorts the true values
b) the horizontal scale is uneven
, c) the vertical scale is uneven
d) the x-axis and y-axis should be reversed
: the a-axis and y-axis should be reversed
11. A study was conducted to see if blood type influenced height?
Which type of classification is this?
a) categorical to categorical
b) categorical to quantitative
c) quantitative to quantitative
d) quantitative to categorical
: categorical to quantitative
12. A study was conducted on the possible relationship between smoking status
and whether or not alcohol is consumed?
Which type of classification is this?
a) categorical to categorical
b) quantitative to categorical