MATH 302 Quiz 1 -
Question and Answers
Question 1 of 20 1.0/ 1.0 Points
What is the term for a characteristic or attribute that can
assume different values?
A. datum
B.exponent
Correct
C.variable
D.sample
Answer Key: C
Question 2 of 20 1.0/ 1.0 Points
A pareto chart does NOT have which of the following
properties? A.It is used to represent categorical data
B. The frequencies are arranged from highest to
lowest Correct C.The frequencies are arranged from
lowest to highest D.It is a bar chart
Answer Key: C
Question 3 of 20 1.0/ 1.0 Points
Suppose that a histogram of a data set is approximately
symmetric and "bell shaped". Approximately what percent of
the observations are within two standard deviations of the
mean?
A.50%
Correct
B.95%
C.68%
D.99.7%
,Answer Key: B
Question 4 of 20 1.0/ 1.0 Points
Suppose that a histogram of a data set is approximately
symmetric and "bell shaped". Approximately, what percent of
the observations are within three standard deviations of the
mean?
A.68
%
B.95
%
Correct
C.99.7%
D.50%
Answer Key: C
Question 5 of 20 1.0/ 1.0 Points
The amount of time needed to run the Boston marathon is an
example of which type of variable?
Correct
A.continuous
B.none of the
above C.qualitative
D.discrete
Answer Key: A
Question 6 of 20 1.0/ 1.0 Points
Gender and State are examples of which type
of data? A.Discrete data
B.Continuous
data C.Ordinal
data
Correct D.Categorical data
,Answer Key: D
Question 7 of 20 1.0/ 1.0 Points
The average score for a class of 30 students was 75. The 20
male students in the class averaged 70. The 10 female
students in the class averaged:
A.7
0
B.7
5
C.6
0
Correct D.85
Answer Key: D
Question 8 of 20 1.0/ 1.0 Points
Data that arise from counts are called:
A.continuous
data B.nominal
data
C.counted data
Correct D.discrete
data
Answer Key: D
Question 9 of 20 1.0/ 1.0 Points
Researchers may gain insight into the characteristics of a
population by examining a
A.mathematical model describing the
population B.description of the population
C.replica
Correct D.sample of the population
, Answer Key: D
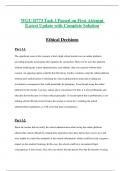
Question 10 of 20 0.0/ 1.0 Points
What type of graph is the figure below?
A.ogive
Incorrect B.relative frequency
histogram C.pictograph
D.Pareto chart
Answer Key: D
Question 11 of 20 1.0/ 1.0 Points
Which of the following statements are false?
Correct A.A categorical variable is nominal if there is natural
ordering of its possible values.
B.A variable is numerical if meaningful arithmetic can be
performed on it. C.Zip codes are usually treated as categorical
variables, although they appear to be numerical.
D.All of the above
Answer Key: A
Question 12 of 20 1.0/ 1.0 Points
For a boxplot, the box itself represents what percent of the
observations? Correct A.middle 50%
B.lower
25%
C.100%
D.upper 75%
Question and Answers
Question 1 of 20 1.0/ 1.0 Points
What is the term for a characteristic or attribute that can
assume different values?
A. datum
B.exponent
Correct
C.variable
D.sample
Answer Key: C
Question 2 of 20 1.0/ 1.0 Points
A pareto chart does NOT have which of the following
properties? A.It is used to represent categorical data
B. The frequencies are arranged from highest to
lowest Correct C.The frequencies are arranged from
lowest to highest D.It is a bar chart
Answer Key: C
Question 3 of 20 1.0/ 1.0 Points
Suppose that a histogram of a data set is approximately
symmetric and "bell shaped". Approximately what percent of
the observations are within two standard deviations of the
mean?
A.50%
Correct
B.95%
C.68%
D.99.7%
,Answer Key: B
Question 4 of 20 1.0/ 1.0 Points
Suppose that a histogram of a data set is approximately
symmetric and "bell shaped". Approximately, what percent of
the observations are within three standard deviations of the
mean?
A.68
%
B.95
%
Correct
C.99.7%
D.50%
Answer Key: C
Question 5 of 20 1.0/ 1.0 Points
The amount of time needed to run the Boston marathon is an
example of which type of variable?
Correct
A.continuous
B.none of the
above C.qualitative
D.discrete
Answer Key: A
Question 6 of 20 1.0/ 1.0 Points
Gender and State are examples of which type
of data? A.Discrete data
B.Continuous
data C.Ordinal
data
Correct D.Categorical data
,Answer Key: D
Question 7 of 20 1.0/ 1.0 Points
The average score for a class of 30 students was 75. The 20
male students in the class averaged 70. The 10 female
students in the class averaged:
A.7
0
B.7
5
C.6
0
Correct D.85
Answer Key: D
Question 8 of 20 1.0/ 1.0 Points
Data that arise from counts are called:
A.continuous
data B.nominal
data
C.counted data
Correct D.discrete
data
Answer Key: D
Question 9 of 20 1.0/ 1.0 Points
Researchers may gain insight into the characteristics of a
population by examining a
A.mathematical model describing the
population B.description of the population
C.replica
Correct D.sample of the population
, Answer Key: D
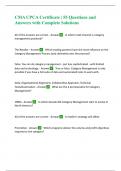
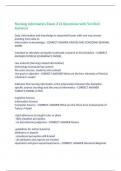
Question 10 of 20 0.0/ 1.0 Points
What type of graph is the figure below?
A.ogive
Incorrect B.relative frequency
histogram C.pictograph
D.Pareto chart
Answer Key: D
Question 11 of 20 1.0/ 1.0 Points
Which of the following statements are false?
Correct A.A categorical variable is nominal if there is natural
ordering of its possible values.
B.A variable is numerical if meaningful arithmetic can be
performed on it. C.Zip codes are usually treated as categorical
variables, although they appear to be numerical.
D.All of the above
Answer Key: A
Question 12 of 20 1.0/ 1.0 Points
For a boxplot, the box itself represents what percent of the
observations? Correct A.middle 50%
B.lower
25%
C.100%
D.upper 75%