Unit 2 Assignment B Applied Science
Scenario:
I am a newly appointed technical staff at a large chemical plant, chemcalquipe.
As a part of my induction period and to progress in my role, I have to
demonstrate skills in a range of practical procedures and techniques. Part of my
role is to ensure equipment is calibrated and equipment and chemicals are
safety checked. I need to demonstrate my ability to use a calorimeter and
associated equipment to obtain data to determine, analyse and evaluate the rate
of cooling of substances. I will need to present evidence of my practical skills
analysis and evaluation in the report.
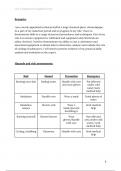
Hazards and risk assessments:
Risk Hazard Precaution Emergency
Burning your skin Boiling water Handle with care Put affected
and wear gloves under cold
water/seek
medical help
Inhalation Paraffin wax Wear a mask Drink plenty of
water
Inhalation, Stearic acid Wear a Seek medical
nausea mask/prevent help
breathing it
Burning yourself Bunsen burner Wear Run affected
gloves/handle area under cold
with care water/ seek
medical help
Cutting /stabbing Glassware Handle with care Seek medical
help
1
,Unit 2 Assignment B Applied Science
Theory:
How does each thermometer work:
Mercury Thermometers:
The material transmits heat energy to the mercury when the tip of the mercury
thermometer comes into contact with the substance being measured. The
mercury then becomes a liquid, swells, and starts to ascend the tube. One can
take a temperature reading at the point where the mercury stops on the scale
(1).
Digital Thermometers:
A digital thermometer's sensor detects a variation in the resistor's electronic
reading when the temperature changes (part of an electric circuit that limits the
flow of electricity). The result of this change in resistance is a change in
temperature. The temperature then is displayed digitally as a number on the
screen (1).
Infrared Thermometers:
Infrared thermometers pick up radiation from things because of the motion of
the molecules inside them. The molecules move more quickly and release more
infrared radiation at higher temperatures.
An infrared thermometer measures the object's radiation and converts it to heat.
The heat is then converted to electricity and delivered to a detector, which
displays a temperature reading as a number on the display (1).
The uses of thermometers:
Mercury Thermometer:
The temperatures of the body, liquid, and vapour can all be determined with
mercury thermometers. The use of mercury thermometers is widespread in
both domestic and commercial settings (2).
Digital thermometers:
Many industries can make use of digital thermometers. Temperature control and
monitoring are necessary for the human body, other living things, food, the
atmosphere, labs, and other scientific applications. Long, thin probes on digital
2
, Unit 2 Assignment B Applied Science
thermometers make them perfect for use with liquids and soft materials. It also
implies that they can get to inaccessible locations (3).
Infrared Thermometers:
Infrared thermometers are mostly used to determine a subject's temperature
from a distance. In circumstances where it is challenging to reach the object to
record the temperature, the device is helpful. The performance of engine
cooling systems can also be checked, and hotspots on electrical systems and
panels with restricted access can be found using infrared thermometers (4).
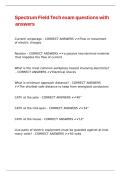
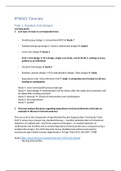
What is a cooling curve:
In the fields of chemistry, physics, engineering, and other sciences, a cooling
curve is a particular sort of graph that is used to track the development of a
cooling substance. On a graph, the x axis is typically used to represent time, and
the y axis is used to show temperature. As a result, a cooling curve often slopes
downward from left to right as the temperature decreases over time.
Because physical phase shifts, such the transformation from liquid to solid, are
commonly represented as cooling curves, they don't necessarily descend at the
same pace across the graph. The temperature drops steadily as the water cools
to the freezing point, but the curve flattens out as the liquid water turns to solid
ice (5).
Image shows what a cooling curve looks like (6).
3
Scenario:
I am a newly appointed technical staff at a large chemical plant, chemcalquipe.
As a part of my induction period and to progress in my role, I have to
demonstrate skills in a range of practical procedures and techniques. Part of my
role is to ensure equipment is calibrated and equipment and chemicals are
safety checked. I need to demonstrate my ability to use a calorimeter and
associated equipment to obtain data to determine, analyse and evaluate the rate
of cooling of substances. I will need to present evidence of my practical skills
analysis and evaluation in the report.
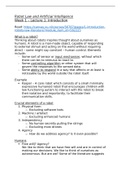
Hazards and risk assessments:
Risk Hazard Precaution Emergency
Burning your skin Boiling water Handle with care Put affected
and wear gloves under cold
water/seek
medical help
Inhalation Paraffin wax Wear a mask Drink plenty of
water
Inhalation, Stearic acid Wear a Seek medical
nausea mask/prevent help
breathing it
Burning yourself Bunsen burner Wear Run affected
gloves/handle area under cold
with care water/ seek
medical help
Cutting /stabbing Glassware Handle with care Seek medical
help
1
,Unit 2 Assignment B Applied Science
Theory:
How does each thermometer work:
Mercury Thermometers:
The material transmits heat energy to the mercury when the tip of the mercury
thermometer comes into contact with the substance being measured. The
mercury then becomes a liquid, swells, and starts to ascend the tube. One can
take a temperature reading at the point where the mercury stops on the scale
(1).
Digital Thermometers:
A digital thermometer's sensor detects a variation in the resistor's electronic
reading when the temperature changes (part of an electric circuit that limits the
flow of electricity). The result of this change in resistance is a change in
temperature. The temperature then is displayed digitally as a number on the
screen (1).
Infrared Thermometers:
Infrared thermometers pick up radiation from things because of the motion of
the molecules inside them. The molecules move more quickly and release more
infrared radiation at higher temperatures.
An infrared thermometer measures the object's radiation and converts it to heat.
The heat is then converted to electricity and delivered to a detector, which
displays a temperature reading as a number on the display (1).
The uses of thermometers:
Mercury Thermometer:
The temperatures of the body, liquid, and vapour can all be determined with
mercury thermometers. The use of mercury thermometers is widespread in
both domestic and commercial settings (2).
Digital thermometers:
Many industries can make use of digital thermometers. Temperature control and
monitoring are necessary for the human body, other living things, food, the
atmosphere, labs, and other scientific applications. Long, thin probes on digital
2
, Unit 2 Assignment B Applied Science
thermometers make them perfect for use with liquids and soft materials. It also
implies that they can get to inaccessible locations (3).
Infrared Thermometers:
Infrared thermometers are mostly used to determine a subject's temperature
from a distance. In circumstances where it is challenging to reach the object to
record the temperature, the device is helpful. The performance of engine
cooling systems can also be checked, and hotspots on electrical systems and
panels with restricted access can be found using infrared thermometers (4).
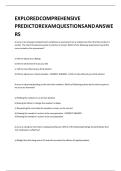
What is a cooling curve:
In the fields of chemistry, physics, engineering, and other sciences, a cooling
curve is a particular sort of graph that is used to track the development of a
cooling substance. On a graph, the x axis is typically used to represent time, and
the y axis is used to show temperature. As a result, a cooling curve often slopes
downward from left to right as the temperature decreases over time.
Because physical phase shifts, such the transformation from liquid to solid, are
commonly represented as cooling curves, they don't necessarily descend at the
same pace across the graph. The temperature drops steadily as the water cools
to the freezing point, but the curve flattens out as the liquid water turns to solid
ice (5).
Image shows what a cooling curve looks like (6).
3