Microeconomics – BS1551 - Rational consumer choice
Digging deeper
In week 2, we said that consumers choose how much to consume by comparing the
marginal benefit of consumption to the price. This week we are going to dig deeper into this
decision and ask: How does a consumer choose between different goods?
Introduction
You have decided to eat out at a new restaurant. The waitress hands you the menu and
there is a lot of choice. How do you decide what to eat?
You need to think about which looks the tastiest, what is best for your diet, etc. All of this
needs to be weighed against the relative prices of the dishes. Maybe you prefer steak to
pizza, but are you willing to pay an extra £10 pay for steak? Maybe you’re not paying for the
bill and your friend is, you may want the steak but feel guilty about going for the more
expensive item.
These are all questions that go through your head in the decision-making process.
All of these factors will contribute to how you decide and your preferences.
Consumption bundles
To think about how a consumer chooses between different goods, we need some way to
represent multiple goods in the same environment, this is a consumption bundle.
A consumption bundle is a particular combination of two or more goods.
- Definition: Consumption bundles represent a basket of combinations of goods and
services that people want to consume.
The units of both axes on consumption graphs are flows, which means physical quantities
per unit of time.
Consumption is always measured as a flow.
- Definition flows: A flow is a physical quantity per unit of time
It is important that time is considered as well because without it there would be no way to
evaluate whether a given quantity of consumption was large or small.
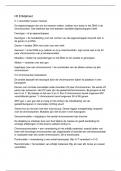
Originally, we only considered a world with only two goods, food, and shelter.
, - On the horizontal axis is the quantity of shelter consumed.
- On the vertical axis is the quantity of food consumed.
- The graph above shows 5 kg of food being consumed and 3 square metres of shelter.
This has a coordinate of (3,5).
- If shelter increases, the point moves to the right.
- If food increases, the point moves up.
Quick question: What would be the coordinates of the following bundles –
A – 5 square metres of shelter and 7kg of food
B – 3 square metres of shelter and 8kg of food
A – (5,7)
B – (3,8)
The first number of the pair in any bundle represents the good measured along the
horizontal axis.
Building blocks of consumption bundles
In order to plot consumption bundles we need to know a few things:
1. What the consumer can afford, for this we need to know:
- Income
- Prices
2. What the consumer likes, for this we need to know:
- Their preferences
The budget constraint
Suppose the consumer has an income of £100 per week.
She wants to buy food (F) and shelter (S).
- Food costs £10 per kg
- Shelter costs £5 per square metre per week.
How much shelter can she afford?
The answer to this depends on how much food she buys.
This can be shown in the table as shown below:
Digging deeper
In week 2, we said that consumers choose how much to consume by comparing the
marginal benefit of consumption to the price. This week we are going to dig deeper into this
decision and ask: How does a consumer choose between different goods?
Introduction
You have decided to eat out at a new restaurant. The waitress hands you the menu and
there is a lot of choice. How do you decide what to eat?
You need to think about which looks the tastiest, what is best for your diet, etc. All of this
needs to be weighed against the relative prices of the dishes. Maybe you prefer steak to
pizza, but are you willing to pay an extra £10 pay for steak? Maybe you’re not paying for the
bill and your friend is, you may want the steak but feel guilty about going for the more
expensive item.
These are all questions that go through your head in the decision-making process.
All of these factors will contribute to how you decide and your preferences.
Consumption bundles
To think about how a consumer chooses between different goods, we need some way to
represent multiple goods in the same environment, this is a consumption bundle.
A consumption bundle is a particular combination of two or more goods.
- Definition: Consumption bundles represent a basket of combinations of goods and
services that people want to consume.
The units of both axes on consumption graphs are flows, which means physical quantities
per unit of time.
Consumption is always measured as a flow.
- Definition flows: A flow is a physical quantity per unit of time
It is important that time is considered as well because without it there would be no way to
evaluate whether a given quantity of consumption was large or small.
Originally, we only considered a world with only two goods, food, and shelter.
, - On the horizontal axis is the quantity of shelter consumed.
- On the vertical axis is the quantity of food consumed.
- The graph above shows 5 kg of food being consumed and 3 square metres of shelter.
This has a coordinate of (3,5).
- If shelter increases, the point moves to the right.
- If food increases, the point moves up.
Quick question: What would be the coordinates of the following bundles –
A – 5 square metres of shelter and 7kg of food
B – 3 square metres of shelter and 8kg of food
A – (5,7)
B – (3,8)
The first number of the pair in any bundle represents the good measured along the
horizontal axis.
Building blocks of consumption bundles
In order to plot consumption bundles we need to know a few things:
1. What the consumer can afford, for this we need to know:
- Income
- Prices
2. What the consumer likes, for this we need to know:
- Their preferences
The budget constraint
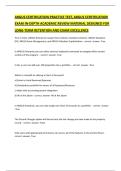
Suppose the consumer has an income of £100 per week.
She wants to buy food (F) and shelter (S).
- Food costs £10 per kg
- Shelter costs £5 per square metre per week.
How much shelter can she afford?
The answer to this depends on how much food she buys.
This can be shown in the table as shown below: