Statistics
Lecture 1: The Normal Distribution
Descriptive Statistics
Mean (μ) = describes the central point of a distribution
Standard Deviation (σ) = describes the variation of a distribution. Small amount if it is close to the
average. The higher amount, the more variation.
These two numbers describe / summarize a group of data.
Descriptive Measures
x =∑x/n = calculating the average outcome
Average
X Outcome
N Number of outcomes
∑ Sum
S = √ ∑ ( x – x ) ^2 / n – 1 = calculating the standard deviation
Probability
How many people do actually have a certain score? Chance that a certain event occurs.
Probability Distribution = list of all possible events, with their probability
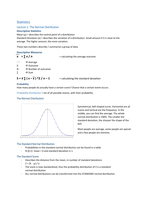
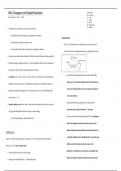
The Normal Distribution
Symmetrical, bell-shaped curve. Horizontal are all
scores and vertical are the frequency. In the
middle, you can find the average. The whole
normal distribution is 100%. The smaller the
standard deviation, the sharper the shape of the
bell.
Most people are average, some people are special
and a few people are extreme.
The Standard Normal Distribution
- Probabilities in the standard normal distribution can be found in a table
- N (0,1): mean = 0 and standard deviation is 1.
The Standard Score
- Describes the distance from the mean, in number of standard deviations
- Z = (X – μ) / σ
- The score is now standardized, thus the probability distribution of Z is a standard
normal distribution
- ALL normal distributions can be transformed into the STANDARD normal distribution
Lecture 1: The Normal Distribution
Descriptive Statistics
Mean (μ) = describes the central point of a distribution
Standard Deviation (σ) = describes the variation of a distribution. Small amount if it is close to the
average. The higher amount, the more variation.
These two numbers describe / summarize a group of data.
Descriptive Measures
x =∑x/n = calculating the average outcome
Average
X Outcome
N Number of outcomes
∑ Sum
S = √ ∑ ( x – x ) ^2 / n – 1 = calculating the standard deviation
Probability
How many people do actually have a certain score? Chance that a certain event occurs.
Probability Distribution = list of all possible events, with their probability
The Normal Distribution
Symmetrical, bell-shaped curve. Horizontal are all
scores and vertical are the frequency. In the
middle, you can find the average. The whole
normal distribution is 100%. The smaller the
standard deviation, the sharper the shape of the
bell.
Most people are average, some people are special
and a few people are extreme.
The Standard Normal Distribution
- Probabilities in the standard normal distribution can be found in a table
- N (0,1): mean = 0 and standard deviation is 1.
The Standard Score
- Describes the distance from the mean, in number of standard deviations
- Z = (X – μ) / σ
- The score is now standardized, thus the probability distribution of Z is a standard
normal distribution
- ALL normal distributions can be transformed into the STANDARD normal distribution