Statistical Correlation Analysis measures relation
among
(2) quantitative, continous variables
->
-
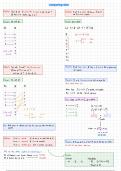
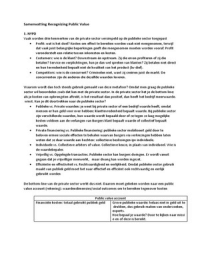
correlation describes the direction and degree of relationship among (2) continous variable measurements.
-
correlation assesses direction anddegree of relatedness, notc ausation Note: Correlational data
is
displayed on scatterplot-
(Y)
-Direction (higher, lower anddegree (weak, strong) -
correlation ↳ Correlation (relatedness) I
causation
↳ Individual Data point(s)
smoking research in the 1950's revealedthat smoking's relationship with
lung cancer does not
explain causation
scientifically
->
3rd-degree confounding
Ex.
Ex.
Genetic risk for addiction
Occupational hazards
variables can also induce cancer
= -60. *
① "Does the of
amount sleep cause changes in GPA?" n o tcorrelation
-
Ex.
x
Stress induction -
E
⑧
⑧
I
⑧
② "Is o fsleep
amount edto GPA?" correlation v
=
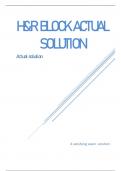
R-value:Indicates strength
o f relatedness
(x)
↑
-
R- sign:Indicates direction of relationship
7. Neg() correlation:41 x (independent)
2. Pos(H) correlation:I
Correlational Coficient -
Pearson Correlational Coficient (R)
of relatedness
↳ Describes direction anddegree
R (x)
(2x)(zy)
=
/ ((N) 2 x 2 -
-
(2x) 2][(N)2x2 -
(2x)2)
R
-),
= R
32x)
=
- 2-transformationin
(mostused:Raw score formula) (mean, SD formula) N(x) numerator,
=
D(X) denominator
=
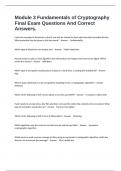
A researcher wanted to see if there was any relationship between the
number of hours studied and test grade. She recruited six students and
Example R and other Analysis recorded information about them in the form of hours studied and what
Computing
-
grade they got on the test (note: raw data is continuous, and consists of
↳ Use table method to organize calculations
two values for each participant). Perform basic correlational analysis.
↳ You need:X?y2, XY, Sum of all columns (2)
Students, Hows R ([xy) (2x)(2x) ([(N)2x2
ont
S N D(x)
(2x)2][(N)2x2
=
(2x)2)
-
=
-
-
I 3 73
SN 6 / ((N) 2 x (2x) 2][(N) 2x2 (2x)2)
(((21)2)(6(44s82i -(516)2]
2 -
=
-
2 S xxx
EX 21
=
=
3 N(x) (6) (1835) -
(21) (816)
4 SY 516
=
=
4 2 79
2 x (11010) (10836) (5236) 40788 201.96
=
↳ = N(x) -
x(x) =
=
=
S
2 2 44582
x =
2 N(x) 174
=
3 SXy 1835 =
6 82%
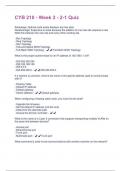
nterpretation R
xx 4
of 0.86 R =
=
0.86-coefrcenti s always
=
between -
and a
Y
=
I
<0.2-small
0:no 0.2-0.3 medium
correlation, Quantifes
↑
relatedness
1: ex tremely (2)
strong neg correlation >0.3 Large
-
1:extremely
strong pos correlation (4) ↳ Pearson of efectsize (ESI
R is also a measure
Conclusion (R=0.83): more hours studiedstrongly relates positive
to p erformance
test
R* proportion of variation in the dependent. V
↑
=
thati s predicted by a model
Coefficient of Determination (R2 R2 0.74 74% of variability in data is well predicted
= =
by statistical model 74%
sred variance.
=
- Indicates the proportion (amount) variance
of a variable re
-
Bemeasures how well a statistical model predicts an outcome D(x) 1 (2X)2][INICEYY-
=
(EX)2]
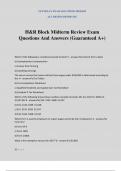
Example-organic chemistry tutor-computing R
=
((6)(91) -
(20)2][(6) (490) -
(4812]
+
Nx)
R N([xy) (2x)(2x) (546 400)(2940 2304)
Yaliz in
-
= =
- -
/ ((N 2 x 2 -
(2x) 2] [(N)[x2 -
(2x)2) -D(X) (146)(636)
2:1, 4, 9, 16,25,36
=
X + [x2 9)(3x4)
2,856
=
Ya"""""""""iaisi,"*x=(6(211) -(20(48)
-
R
=7
304.72 10
=
=
n 6
=
1266
=
-
960
EX 20 =
306
=
[Y 48 =
·Very strong (t) linear relationship.
, Linear Regression -
Correlation vs
Regression
tells
us where line is is
going
I
-
A linear regression models the relationship between a variables predictscores for
to y-dependent. When X-Independenti s known
nearRegressionmodelsrelationshipamongaariablein
- A correlation only gives information aboutdirection andmagnitude relationship
of
.
-
Both establish/Indicate
a relationship; butonly regression can predicto utcome of Y-scores(dependent)
Regression Equation: " a "and" b "
Regression coeficient
=
-
mean of y
Interceptw) value for which
-
↑
y- axIS
↑
you predict
Y for
↑
y =
a bx
+
9
b n[xy =
-
((x)(2x); a Y
=
-
bx- mean of x
↳ slope
↓ n x2 -
(2x)2
Predicted Y-value
known X
given a
⑧a x bx
=
-
3
-- E=
X
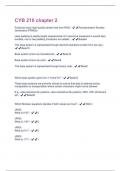
Example -
Computing Formula, n 7
=
how you have all the
4
2 2
x Y x y XY b n2xy (2x)(9Y)
information you need
= -
r2x2
4
(3x)2
I 2 I 2
-
a (3)
=
-
(0.62)(3.57) to draw and make
b (7)(867 (25)(21) estimations off a
of
214 12
-
0.79
=
a =
regression model
(7)(107) (25) 2
33996
-
.Y 0.79
= +
0.62x
b 0.62 =
421648
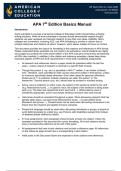
45 1625 208 Drawing Model model: Y 0.79 + 0.62x
=
15(3/25)9/15/1. start line using
6 Y
median point (x,y)
2. Use x 0
=
to locate another point
615/33/25/30
-
5: ④ ·
I If x 0
=
Ex=1072x=77
Y 0.79 (0.62)(0)
[x=25 2Y 21
= [XY=
86
+
=
4
(3.6,3)
Y =
0.79 0
+
3 .
·
-
·r(X, y) (0,0.79)
(x,y) (3.6,3.0)
=
=
L - & ⑧
(I,
⑧ 1.41
- ⑧
3. Draw a line connecting the 121 points
(0,0.79)
4. Check line accuracy X Pant 0: (, 5), Point:x 0 =
↓ ! !S is
With X 1 =
Y 0.79
=
(0.62)x
+
You can
plug in any x-value and the model will estimate
the
regression
Y 0.79
-
(0.62)(1) y-value using 4 0.79 + (0.62) X
p(1,1.41)
=
+
=
M
y 0.79 0.62
=
+
4 1.42=
-
R Sample Statistic
=
In
-
statistics, parameters are symbolized
by
Greek -
Closer the points regression
are to line:
greater R-value
letters while statists are
symbolized latin
with letters
R degree/direction linear relation 2 bivariate distributions
of
among
=
-
among
(2) quantitative, continous variables
->
-
correlation describes the direction and degree of relationship among (2) continous variable measurements.
-
correlation assesses direction anddegree of relatedness, notc ausation Note: Correlational data
is
displayed on scatterplot-
(Y)
-Direction (higher, lower anddegree (weak, strong) -
correlation ↳ Correlation (relatedness) I
causation
↳ Individual Data point(s)
smoking research in the 1950's revealedthat smoking's relationship with
lung cancer does not
explain causation
scientifically
->
3rd-degree confounding
Ex.
Ex.
Genetic risk for addiction
Occupational hazards
variables can also induce cancer
= -60. *
① "Does the of
amount sleep cause changes in GPA?" n o tcorrelation
-
Ex.
x
Stress induction -
E
⑧
⑧
I
⑧
② "Is o fsleep
amount edto GPA?" correlation v
=
R-value:Indicates strength
o f relatedness
(x)
↑
-
R- sign:Indicates direction of relationship
7. Neg() correlation:41 x (independent)
2. Pos(H) correlation:I
Correlational Coficient -
Pearson Correlational Coficient (R)
of relatedness
↳ Describes direction anddegree
R (x)
(2x)(zy)
=
/ ((N) 2 x 2 -
-
(2x) 2][(N)2x2 -
(2x)2)
R
-),
= R
32x)
=
- 2-transformationin
(mostused:Raw score formula) (mean, SD formula) N(x) numerator,
=
D(X) denominator
=
A researcher wanted to see if there was any relationship between the
number of hours studied and test grade. She recruited six students and
Example R and other Analysis recorded information about them in the form of hours studied and what
Computing
-
grade they got on the test (note: raw data is continuous, and consists of
↳ Use table method to organize calculations
two values for each participant). Perform basic correlational analysis.
↳ You need:X?y2, XY, Sum of all columns (2)
Students, Hows R ([xy) (2x)(2x) ([(N)2x2
ont
S N D(x)
(2x)2][(N)2x2
=
(2x)2)
-
=
-
-
I 3 73
SN 6 / ((N) 2 x (2x) 2][(N) 2x2 (2x)2)
(((21)2)(6(44s82i -(516)2]
2 -
=
-
2 S xxx
EX 21
=
=
3 N(x) (6) (1835) -
(21) (816)
4 SY 516
=
=
4 2 79
2 x (11010) (10836) (5236) 40788 201.96
=
↳ = N(x) -
x(x) =
=
=
S
2 2 44582
x =
2 N(x) 174
=
3 SXy 1835 =
6 82%
nterpretation R
xx 4
of 0.86 R =
=
0.86-coefrcenti s always
=
between -
and a
Y
=
I
<0.2-small
0:no 0.2-0.3 medium
correlation, Quantifes
↑
relatedness
1: ex tremely (2)
strong neg correlation >0.3 Large
-
1:extremely
strong pos correlation (4) ↳ Pearson of efectsize (ESI
R is also a measure
Conclusion (R=0.83): more hours studiedstrongly relates positive
to p erformance
test
R* proportion of variation in the dependent. V
↑
=
thati s predicted by a model
Coefficient of Determination (R2 R2 0.74 74% of variability in data is well predicted
= =
by statistical model 74%
sred variance.
=
- Indicates the proportion (amount) variance
of a variable re
-
Bemeasures how well a statistical model predicts an outcome D(x) 1 (2X)2][INICEYY-
=
(EX)2]
Example-organic chemistry tutor-computing R
=
((6)(91) -
(20)2][(6) (490) -
(4812]
+
Nx)
R N([xy) (2x)(2x) (546 400)(2940 2304)
Yaliz in
-
= =
- -
/ ((N 2 x 2 -
(2x) 2] [(N)[x2 -
(2x)2) -D(X) (146)(636)
2:1, 4, 9, 16,25,36
=
X + [x2 9)(3x4)
2,856
=
Ya"""""""""iaisi,"*x=(6(211) -(20(48)
-
R
=7
304.72 10
=
=
n 6
=
1266
=
-
960
EX 20 =
306
=
[Y 48 =
·Very strong (t) linear relationship.
, Linear Regression -
Correlation vs
Regression
tells
us where line is is
going
I
-
A linear regression models the relationship between a variables predictscores for
to y-dependent. When X-Independenti s known
nearRegressionmodelsrelationshipamongaariablein
- A correlation only gives information aboutdirection andmagnitude relationship
of
.
-
Both establish/Indicate
a relationship; butonly regression can predicto utcome of Y-scores(dependent)
Regression Equation: " a "and" b "
Regression coeficient
=
-
mean of y
Interceptw) value for which
-
↑
y- axIS
↑
you predict
Y for
↑
y =
a bx
+
9
b n[xy =
-
((x)(2x); a Y
=
-
bx- mean of x
↳ slope
↓ n x2 -
(2x)2
Predicted Y-value
known X
given a
⑧a x bx
=
-
3
-- E=
X
Example -
Computing Formula, n 7
=
how you have all the
4
2 2
x Y x y XY b n2xy (2x)(9Y)
information you need
= -
r2x2
4
(3x)2
I 2 I 2
-
a (3)
=
-
(0.62)(3.57) to draw and make
b (7)(867 (25)(21) estimations off a
of
214 12
-
0.79
=
a =
regression model
(7)(107) (25) 2
33996
-
.Y 0.79
= +
0.62x
b 0.62 =
421648
45 1625 208 Drawing Model model: Y 0.79 + 0.62x
=
15(3/25)9/15/1. start line using
6 Y
median point (x,y)
2. Use x 0
=
to locate another point
615/33/25/30
-
5: ④ ·
I If x 0
=
Ex=1072x=77
Y 0.79 (0.62)(0)
[x=25 2Y 21
= [XY=
86
+
=
4
(3.6,3)
Y =
0.79 0
+
3 .
·
-
·r(X, y) (0,0.79)
(x,y) (3.6,3.0)
=
=
L - & ⑧
(I,
⑧ 1.41
- ⑧
3. Draw a line connecting the 121 points
(0,0.79)
4. Check line accuracy X Pant 0: (, 5), Point:x 0 =
↓ ! !S is
With X 1 =
Y 0.79
=
(0.62)x
+
You can
plug in any x-value and the model will estimate
the
regression
Y 0.79
-
(0.62)(1) y-value using 4 0.79 + (0.62) X
p(1,1.41)
=
+
=
M
y 0.79 0.62
=
+
4 1.42=
-
R Sample Statistic
=
In
-
statistics, parameters are symbolized
by
Greek -
Closer the points regression
are to line:
greater R-value
letters while statists are
symbolized latin
with letters
R degree/direction linear relation 2 bivariate distributions
of
among
=
-