Model selection and regularization
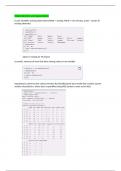
is.na(): identifies missing observations(TRUE = missing, FALSE = non-missing, sum() = counts all
missing elements)
Salary is missing for 59 players
na.omit(): removes all rows that have missing values in any variable
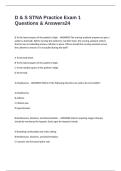
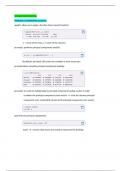
regsubsets(): performs best subset selection (by identifying the best model that contains a given
number of predictors, where best is quantified using RSS) (syntax is same as for lm())
, summary(): outputs best set of variables for each model size
*: variable included in corresponding model( here: best two-variable model contains only Hits and
CRBI)
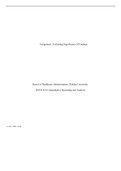
regsubsets(): by default, reports only the best eight-variable model
nvmax: returns as many variables as are desired
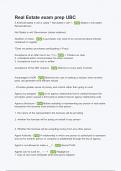
reg.summary(): returns R2, RSS, adjusted R2, Cp and BIC
R2 increases from 32% ( = 1 variable) to almost 55% ( = all variables)
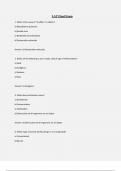
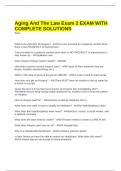
Type= “1” : connect plotted points with lines
points(): like plot(), except it puts points on a plot that has already been created, instead of creating a
new plot
which.max(): identify location of the maximum point of a vector
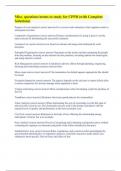
Red dot = model
with largest
adjusted R2
statistic
is.na(): identifies missing observations(TRUE = missing, FALSE = non-missing, sum() = counts all
missing elements)
Salary is missing for 59 players
na.omit(): removes all rows that have missing values in any variable
regsubsets(): performs best subset selection (by identifying the best model that contains a given
number of predictors, where best is quantified using RSS) (syntax is same as for lm())
, summary(): outputs best set of variables for each model size
*: variable included in corresponding model( here: best two-variable model contains only Hits and
CRBI)
regsubsets(): by default, reports only the best eight-variable model
nvmax: returns as many variables as are desired
reg.summary(): returns R2, RSS, adjusted R2, Cp and BIC
R2 increases from 32% ( = 1 variable) to almost 55% ( = all variables)
Type= “1” : connect plotted points with lines
points(): like plot(), except it puts points on a plot that has already been created, instead of creating a
new plot
which.max(): identify location of the maximum point of a vector
Red dot = model
with largest
adjusted R2
statistic