Lecture notes
Lecture 1: Correlations and Measures of Effect Size
Correlation (and scatterplots)
Correlation is not causation. Correlation: is there an association between 2 variables?
Causality: is there an effect?
- Covariance (association)
- Directionality (cause precedes effect)
- Internal validity (eliminate alternative explanations
Scatterplots:
- Direction: positive/negative
- Strength: more points on straight line., stronger relation
- Shape: linear/nonlinear & homogeneous/heterogeneous
- Outliers: points that lie far from others
Covariance: degree to which two variables vary together
Pearson Product-Moment: describes the linear relationship between two
quantitative variables and always lies between −1 and +1
Factors that affect Pearson r:
- Non-linear relationships
- Outliers
- Heterogeneous subgroups
- Restrictions of range
Alternative correlation techniques
Pearson r mostly used, but more variations depending on measurement level &
r is not a robust measure, because it is affected by outliers
, Spearman’s rho (rs): Describes relationship between two ordinal variables and/or
ranked scores. If scores are not ranked already: convert raw scores into ranks.
Then use Pearson correlation formula to calculate rs. rs = r on ranked data and
Point-Biserial Correlation (rpb): Describes relationship between quantitative and
dichotomous variable. rpb = r
Phi Coefficient (φ): Describes relationship between two dichotomous variables.
φ = r.
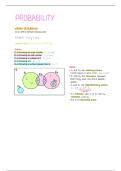
Relationship φ and χ2:
Testing the significance of r
Discussed correlation techniques used in samples, but what does it say about a population?
(r can be every correlation technique)
Measures of effect size
Statistical significance depends on N, r, and α
Results:
- Weak correlations in large samples can become significant
- Strong correlations in small samples might not significant
Conclusion: Testing only for significance is too limited
reffect: r can stand every correlation technique and square r, to prevent hard to interpret
correlation value:
r2: also called VAF and COD
Cohen’s d and Hedges’ g: Suitable for comparing the means of two groups (rpb).
Cohen’s d based on population parameters; Hedges’ g on sample statistics
Relation between t and Hedges’ g:
, Rules of thumb:
Lecture 2: simple linear regression
Regression: enables you to predict one interval variable from one or more others
1 predictor = simple
2 predictors = multiple
Regression line = the vertical squared deviations between the dots and the regression line is
smallest
Regression equation
B0 = intercept/constant: predicted value of Y when X = 0
B1 = slope: size of the difference in Y if X increases by 1 unit
Ei (error) = observed yi – predicted yi
Steps:
1. Formulate the regression equation for these data -> calculate b1, b0 and y
(regression line)
2. What is the predicted number of hours of sleep for a mother with a 5-month old
baby? -> fill in x in new formula y
Interpolation: making a prediction within the range of X and Y
Extrapolation: making a prediction outside the range of X and Y
Solution to when unit of measurement changes: standardised regression
Lecture 1: Correlations and Measures of Effect Size
Correlation (and scatterplots)
Correlation is not causation. Correlation: is there an association between 2 variables?
Causality: is there an effect?
- Covariance (association)
- Directionality (cause precedes effect)
- Internal validity (eliminate alternative explanations
Scatterplots:
- Direction: positive/negative
- Strength: more points on straight line., stronger relation
- Shape: linear/nonlinear & homogeneous/heterogeneous
- Outliers: points that lie far from others
Covariance: degree to which two variables vary together
Pearson Product-Moment: describes the linear relationship between two
quantitative variables and always lies between −1 and +1
Factors that affect Pearson r:
- Non-linear relationships
- Outliers
- Heterogeneous subgroups
- Restrictions of range
Alternative correlation techniques
Pearson r mostly used, but more variations depending on measurement level &
r is not a robust measure, because it is affected by outliers
, Spearman’s rho (rs): Describes relationship between two ordinal variables and/or
ranked scores. If scores are not ranked already: convert raw scores into ranks.
Then use Pearson correlation formula to calculate rs. rs = r on ranked data and
Point-Biserial Correlation (rpb): Describes relationship between quantitative and
dichotomous variable. rpb = r
Phi Coefficient (φ): Describes relationship between two dichotomous variables.
φ = r.
Relationship φ and χ2:
Testing the significance of r
Discussed correlation techniques used in samples, but what does it say about a population?
(r can be every correlation technique)
Measures of effect size
Statistical significance depends on N, r, and α
Results:
- Weak correlations in large samples can become significant
- Strong correlations in small samples might not significant
Conclusion: Testing only for significance is too limited
reffect: r can stand every correlation technique and square r, to prevent hard to interpret
correlation value:
r2: also called VAF and COD
Cohen’s d and Hedges’ g: Suitable for comparing the means of two groups (rpb).
Cohen’s d based on population parameters; Hedges’ g on sample statistics
Relation between t and Hedges’ g:
, Rules of thumb:
Lecture 2: simple linear regression
Regression: enables you to predict one interval variable from one or more others
1 predictor = simple
2 predictors = multiple
Regression line = the vertical squared deviations between the dots and the regression line is
smallest
Regression equation
B0 = intercept/constant: predicted value of Y when X = 0
B1 = slope: size of the difference in Y if X increases by 1 unit
Ei (error) = observed yi – predicted yi
Steps:
1. Formulate the regression equation for these data -> calculate b1, b0 and y
(regression line)
2. What is the predicted number of hours of sleep for a mother with a 5-month old
baby? -> fill in x in new formula y
Interpolation: making a prediction within the range of X and Y
Extrapolation: making a prediction outside the range of X and Y
Solution to when unit of measurement changes: standardised regression