Week 10
Financial Analysis – Financial Statements and Market Ratios
Learning Objectives
• Understand:
• The drivers of Return on Total assets
• The drivers of Return on Equity
• Integration of ratios
• The effects of Total Asset Turnover and Net Margin on Return on Total assets
• The effects of Total Asset Turnover, Net Margin and Equity Multiplier on
Return on Equity (Du Pont Analysis)
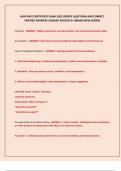
Driver’s of Return on Total Assets
Total asset turnover × Net profit margin=Return on total assets
Revenue Net profit Net profit
Total Assets Revenue Total Assets
Return on total assets is Net profit /total assets, which indicates the return in profit
for each rand invested in assets.
It looks at how well your assets generate overall net profit for a particular company.
Return on assets can be broken down and analysed into two further components,
namely, Total assets turnover and net profit margin.
Total asset turnover looks at efficiency, how efficient is the company at using their
assets to generate revenue and Net Profit Margin looks at profitability, how much of
a company’s revenue results in actual profit.
, - we are able to see whether a company did not receive the expected return due
to: either assets weren’t producing enough revenue (efficiency) or the revenue
wasn’t translating into actual profits (profitability).
Driver’s of Return on Equity
(Du Pont Analysis)
Efficiency Profitability Leverage
Total asset turnover × Net profit margin × Equity multiplier=Return on Equity
Revenue Net Profit Total Assets Net Profit
Total Assets Revenue Total Equity Total Equity
Return on Equity through the use of a Du Pont Analysis.
- This takes into account efficiency, profitability and leverage/gearing.
The equity multiplier, tells us how much of a company’s assets are financed through
equity.
- A low equity multiplier indicates that a company is using more equity and less
debt to finance their assets.
- Companies with lower equity multipliers are considered less risky as they may
have a lower debt burden.
- However, this may not always be the case as some companies who have higher
equity multipliers are not always seen as more risky as the high use of debt may
be part of an effective strategy to purchasing assets at a lower cost as opposed to
using equity.
- It ties into whether not the company is using their assets in an effective way to
generate profits in order to service their debt.
Financial Analysis – Financial Statements and Market Ratios
Learning Objectives
• Understand:
• The drivers of Return on Total assets
• The drivers of Return on Equity
• Integration of ratios
• The effects of Total Asset Turnover and Net Margin on Return on Total assets
• The effects of Total Asset Turnover, Net Margin and Equity Multiplier on
Return on Equity (Du Pont Analysis)
Driver’s of Return on Total Assets
Total asset turnover × Net profit margin=Return on total assets
Revenue Net profit Net profit
Total Assets Revenue Total Assets
Return on total assets is Net profit /total assets, which indicates the return in profit
for each rand invested in assets.
It looks at how well your assets generate overall net profit for a particular company.
Return on assets can be broken down and analysed into two further components,
namely, Total assets turnover and net profit margin.
Total asset turnover looks at efficiency, how efficient is the company at using their
assets to generate revenue and Net Profit Margin looks at profitability, how much of
a company’s revenue results in actual profit.
, - we are able to see whether a company did not receive the expected return due
to: either assets weren’t producing enough revenue (efficiency) or the revenue
wasn’t translating into actual profits (profitability).
Driver’s of Return on Equity
(Du Pont Analysis)
Efficiency Profitability Leverage
Total asset turnover × Net profit margin × Equity multiplier=Return on Equity
Revenue Net Profit Total Assets Net Profit
Total Assets Revenue Total Equity Total Equity
Return on Equity through the use of a Du Pont Analysis.
- This takes into account efficiency, profitability and leverage/gearing.
The equity multiplier, tells us how much of a company’s assets are financed through
equity.
- A low equity multiplier indicates that a company is using more equity and less
debt to finance their assets.
- Companies with lower equity multipliers are considered less risky as they may
have a lower debt burden.
- However, this may not always be the case as some companies who have higher
equity multipliers are not always seen as more risky as the high use of debt may
be part of an effective strategy to purchasing assets at a lower cost as opposed to
using equity.
- It ties into whether not the company is using their assets in an effective way to
generate profits in order to service their debt.