Case Solutions
The cases were included in this text to provide the students with less structured
problem settings. If your students are like my of ours, they will come to you saying
something like “It doesn’t say what I am suppose to do!” Our response is to tell them that
when they graduate and go to work for an organization, their job tasks are not going to be
as structured as the homework problems. Working the cases is good practice for dealing
with some uncertainty and ambiguity.
We also like to assign cases for the purpose of incorporating technical report writing
into the statistics course. Students cannot get too much of this and along with a major term
project and working the database problems, the cases provide a good opportunity for the
students to express themselves in writing.
There are two types of cases in the text. For some cases specific tasks are listed. For
these cases the requirements are obvious – complete the assigned tasks. Other cases are
much less structured; presenting perhaps a more realistic view of using statistical tools.
For those cases the solutions that follow were not intended to be prepared in the form that
the student would submit his or her case study. Rather, they were prepared to provide the
instructor with some notes to use in evaluating the students’ work. We recognize that
every instructor has his or her own preferences for how a case study should be prepared.
However, the outline we recommend is the following:
1. Identify the central issue(s) of the case.
2. Present an overview of the statistical methods that will be used to help deal with the
issue(s).
3. Outline the facts of the case.
4. Determine any necessary assumptions along with a justification for making the
assumptions.
5. Present an analysis of the facts of the case, including use of statistical tables and
charts.
6. Present conclusions tied back to the central issues of the case.
All this is presented in a format that would be expected in industry, including typed
narrative and neatly presented tables and figures.
, Since we make use of the computer in teaching the course, we expect the students to
make use of the computer in solving the cases when there is an advantage in doing so.
,Case 2.1 - Server Downtime
This is a case with specific tasks. The central issue of this case involves the use of
graphical descriptive statistical techniques. When we assign this case, the students are
evaluated on their use of the techniques illustrated in Chapter 2. In addition, we look for
other creative uses of descriptive statistics to present the data creatively. The students
should use Excel’s pivot table features to group the downtime causes
For part e of the case, we look for a well-organized and neatly presented written report
including narrative that explains the graphs and charts along with conclusions reached
from analyzing the data.
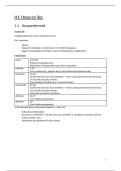
a.
b.
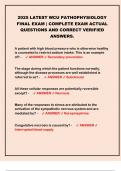
Count of Error Types
Weekly Virus Scan
Memory Errors
Lockups
0 2 4 6 8 10 12
Count
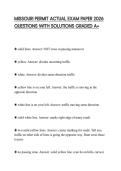
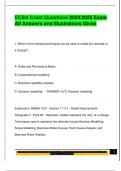
c. This is the Excel default histogram. Other histograms will be different depending on
class limits.
, Histogram
10
9
8
7
6
5
4
3
2
1
0
10 22.5 35 47.5 More
Minutes
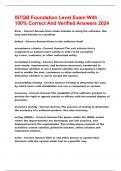
d.
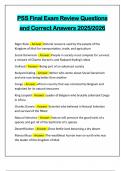
Percentage Dow ntim e by Cause
Weekly Virus Lockups
Scan 24%
33%
Manual Re-
start
3%
Slow Startup
6% Memory Errors
34%
e. We urge our students to look at business periodicals such as Fortune magazine for
examples of effective graphical descriptive techniques. In this case we look for a well-
organized and neatly presented written report including narrative that explains the
graphs and charts along with conclusions reached from analyzing the data.
The cases were included in this text to provide the students with less structured
problem settings. If your students are like my of ours, they will come to you saying
something like “It doesn’t say what I am suppose to do!” Our response is to tell them that
when they graduate and go to work for an organization, their job tasks are not going to be
as structured as the homework problems. Working the cases is good practice for dealing
with some uncertainty and ambiguity.
We also like to assign cases for the purpose of incorporating technical report writing
into the statistics course. Students cannot get too much of this and along with a major term
project and working the database problems, the cases provide a good opportunity for the
students to express themselves in writing.
There are two types of cases in the text. For some cases specific tasks are listed. For
these cases the requirements are obvious – complete the assigned tasks. Other cases are
much less structured; presenting perhaps a more realistic view of using statistical tools.
For those cases the solutions that follow were not intended to be prepared in the form that
the student would submit his or her case study. Rather, they were prepared to provide the
instructor with some notes to use in evaluating the students’ work. We recognize that
every instructor has his or her own preferences for how a case study should be prepared.
However, the outline we recommend is the following:
1. Identify the central issue(s) of the case.
2. Present an overview of the statistical methods that will be used to help deal with the
issue(s).
3. Outline the facts of the case.
4. Determine any necessary assumptions along with a justification for making the
assumptions.
5. Present an analysis of the facts of the case, including use of statistical tables and
charts.
6. Present conclusions tied back to the central issues of the case.
All this is presented in a format that would be expected in industry, including typed
narrative and neatly presented tables and figures.
, Since we make use of the computer in teaching the course, we expect the students to
make use of the computer in solving the cases when there is an advantage in doing so.
,Case 2.1 - Server Downtime
This is a case with specific tasks. The central issue of this case involves the use of
graphical descriptive statistical techniques. When we assign this case, the students are
evaluated on their use of the techniques illustrated in Chapter 2. In addition, we look for
other creative uses of descriptive statistics to present the data creatively. The students
should use Excel’s pivot table features to group the downtime causes
For part e of the case, we look for a well-organized and neatly presented written report
including narrative that explains the graphs and charts along with conclusions reached
from analyzing the data.
a.
b.
Count of Error Types
Weekly Virus Scan
Memory Errors
Lockups
0 2 4 6 8 10 12
Count
c. This is the Excel default histogram. Other histograms will be different depending on
class limits.
, Histogram
10
9
8
7
6
5
4
3
2
1
0
10 22.5 35 47.5 More
Minutes
d.
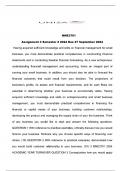
Percentage Dow ntim e by Cause
Weekly Virus Lockups
Scan 24%
33%
Manual Re-
start
3%
Slow Startup
6% Memory Errors
34%
e. We urge our students to look at business periodicals such as Fortune magazine for
examples of effective graphical descriptive techniques. In this case we look for a well-
organized and neatly presented written report including narrative that explains the
graphs and charts along with conclusions reached from analyzing the data.