MTH1W/8 molenhuis unit: Relationships & Data lesson:
Two-Variable – Scatter Plots, Line of Best Fit (LOBF) & Ti-Nspire™ (2 day lesson)
A _____________________________________ is a chart that is usually used to observe and display relationships between _________ variables.
The values of each variable are represented by dots. The relationship between two variables can be described as:
• (I) __________________________________________________________
• (II) __________________________________________________________
• (III) __________________________________________________________
Ex1.
Describe the relationship:
• (I) __________________________________________
• (II) __________________________________________
• (III) __________________________________________
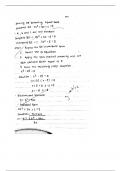
Ex2a. Draw a scatter plot using the data provided. Remember to label all parts of your graph.
Describe the relationship:
1
, MTH1W/8 molenhuis unit: Relationships & Data lesson:
Line of Best Fit (LOBF) and Mean Line of Best Fit
The line of best fit (LOBF), also known as a trendline, is a ___________________ line that _______________ represents the data on a scatter plot.
The line may pass through all of the points, some of the points, or none of the points. This line can then be used to make predictions.
Ex2b. Go back to the graph on Ex2 and draw the line of best fit on the graph.
The mean line of best fit is identical to the LOBF, except that it MUST include the mean point. To find the mean point, determine the
_______________________________ for all the x-values and the “average” for all the y-values, then write them as a coordinate.
Ex2c. (i) Calculate the mean point for Ex2.
(ii) Go back to the graph on Ex2. and include the mean point, draw the mean line of best fit.
What do you notice?
Correlation Coefficient (R) vs. Coefficient of Determination (R2)
Correlation Coefficient (R) or r → It is a measure of how strongly a pair of variables are related.
It tells the strength of linear association between x and y .
i.e. the more time on a treadmill, more the calories burned. It usually varies between -1 and +1 and if it’s closer to 1 then variables are said
to be highly linearly proportion and if close to -1 then highly linearly inversely proportional. If R is close to 0, then there is no relation. 1
Coefficient of Determination (R2) or r 2 →
It is a measure of how variance in y is explained by the regression model; (any regression model: linear, quadratic, exponential, etc.)
Often if a model traces close to the actual values then the Coefficient of Determination is high (0.85 - ~0.9999), otherwise the model
needs to be revisited and recalculated.1
Tighter Model : r 2 = _________
Looser Model : r 2 = _________
tighter model
looser model
1
https://www.quora.com/what-is-the-difference-between-r-and-R-squared
2
Two-Variable – Scatter Plots, Line of Best Fit (LOBF) & Ti-Nspire™ (2 day lesson)
A _____________________________________ is a chart that is usually used to observe and display relationships between _________ variables.
The values of each variable are represented by dots. The relationship between two variables can be described as:
• (I) __________________________________________________________
• (II) __________________________________________________________
• (III) __________________________________________________________
Ex1.
Describe the relationship:
• (I) __________________________________________
• (II) __________________________________________
• (III) __________________________________________
Ex2a. Draw a scatter plot using the data provided. Remember to label all parts of your graph.
Describe the relationship:
1
, MTH1W/8 molenhuis unit: Relationships & Data lesson:
Line of Best Fit (LOBF) and Mean Line of Best Fit
The line of best fit (LOBF), also known as a trendline, is a ___________________ line that _______________ represents the data on a scatter plot.
The line may pass through all of the points, some of the points, or none of the points. This line can then be used to make predictions.
Ex2b. Go back to the graph on Ex2 and draw the line of best fit on the graph.
The mean line of best fit is identical to the LOBF, except that it MUST include the mean point. To find the mean point, determine the
_______________________________ for all the x-values and the “average” for all the y-values, then write them as a coordinate.
Ex2c. (i) Calculate the mean point for Ex2.
(ii) Go back to the graph on Ex2. and include the mean point, draw the mean line of best fit.
What do you notice?
Correlation Coefficient (R) vs. Coefficient of Determination (R2)
Correlation Coefficient (R) or r → It is a measure of how strongly a pair of variables are related.
It tells the strength of linear association between x and y .
i.e. the more time on a treadmill, more the calories burned. It usually varies between -1 and +1 and if it’s closer to 1 then variables are said
to be highly linearly proportion and if close to -1 then highly linearly inversely proportional. If R is close to 0, then there is no relation. 1
Coefficient of Determination (R2) or r 2 →
It is a measure of how variance in y is explained by the regression model; (any regression model: linear, quadratic, exponential, etc.)
Often if a model traces close to the actual values then the Coefficient of Determination is high (0.85 - ~0.9999), otherwise the model
needs to be revisited and recalculated.1
Tighter Model : r 2 = _________
Looser Model : r 2 = _________
tighter model
looser model
1
https://www.quora.com/what-is-the-difference-between-r-and-R-squared
2