MTH1W/8 molenhuis unit: Relationships & Data lesson:
One-Variable – Measures of Central Tendency (mean, median, mode)
What is a “Data”?
Data are units of information collected through Let us first brainstorm some occasions that involve data collection:
observation or experiments. Data is usually numerical,
but not always. Many industries require the use of data,
like research, business management (e.g. sales),
finance, government (e.g. population), and pretty much
any other human activity where something needs to be
organized and understood.
Data are collected, measured, analyzed, and reported. Data can also be visualized as graphs or charts. Collecting data allows us to
understand relationships and make predictions. We will be going over several visual displays of data in this lesson, each serving a
different purpose.
Displaying Data: a) Name each type of display
b) What might be the question asked for each data collection?
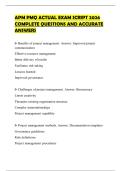
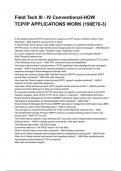
Bar Graph/Histogram
Bar graph is used when data are _______________________ or ________________________________.
Histogram is used when data are _____________________________________.
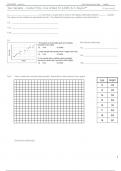
Determine what type of graph is shown below:
1
, MTH1W/8 molenhuis unit: Relationships & Data lesson:
Pencil Activity:
Ex1. Let us take a look at our pencil case and check how many pencils we carry.
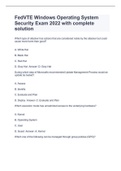
a) We will organize the data into a frequency table.
# of Pencils Frequency # of Pencils Frequency
b) Should we use a histogram or a bar graph to display the data? Why?
c) Describe the shape of the bar graph/histogram: ________________________________________________________________________
d) How many pencils do most people carry?
Mode is:
e) Order the data (number of pencils) from low to high. What is the middle number in the list?
Median is:
f) What is the average number of pencils that people carry? Is it the same as mode or median?
Mean is:
g) Mean, median and mode are three different ways of measuring where the centre of the data is,
referred to as measure of central tendency. In this activity, which central tendency is most useful? Justify.
2
One-Variable – Measures of Central Tendency (mean, median, mode)
What is a “Data”?
Data are units of information collected through Let us first brainstorm some occasions that involve data collection:
observation or experiments. Data is usually numerical,
but not always. Many industries require the use of data,
like research, business management (e.g. sales),
finance, government (e.g. population), and pretty much
any other human activity where something needs to be
organized and understood.
Data are collected, measured, analyzed, and reported. Data can also be visualized as graphs or charts. Collecting data allows us to
understand relationships and make predictions. We will be going over several visual displays of data in this lesson, each serving a
different purpose.
Displaying Data: a) Name each type of display
b) What might be the question asked for each data collection?
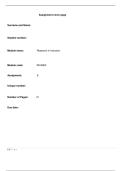
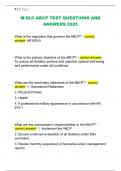
Bar Graph/Histogram
Bar graph is used when data are _______________________ or ________________________________.
Histogram is used when data are _____________________________________.
Determine what type of graph is shown below:
1
, MTH1W/8 molenhuis unit: Relationships & Data lesson:
Pencil Activity:
Ex1. Let us take a look at our pencil case and check how many pencils we carry.
a) We will organize the data into a frequency table.
# of Pencils Frequency # of Pencils Frequency
b) Should we use a histogram or a bar graph to display the data? Why?
c) Describe the shape of the bar graph/histogram: ________________________________________________________________________
d) How many pencils do most people carry?
Mode is:
e) Order the data (number of pencils) from low to high. What is the middle number in the list?
Median is:
f) What is the average number of pencils that people carry? Is it the same as mode or median?
Mean is:
g) Mean, median and mode are three different ways of measuring where the centre of the data is,
referred to as measure of central tendency. In this activity, which central tendency is most useful? Justify.
2