Topic 1.6: Bonding
Summary
Ionic bonding
a) Evidence
The existence of ions is shown by the electron density maps of ionic compounds produced by x-ray diffraction. Ionic
compounds have high melting and boiling points due to the strong electrostatic forces between particles. They do not
conduct electricity in the solid state but do conduct electricity when molten or in solution (when the charged particles
are free to move). During electrolysis, positive ions move towards the cathode whilst negative ions move towards the
anode. If either or both of the ions are coloured, this motion may be visualised (e.g. copper(II) chromate contains blue
cations and yellow anions) as the ions move in opposite directions
b) Formation of ions
Cations are formed when an atom loses one or more electrons; anions by the gain of one or more electrons
c) Dot and cross diagrams -
+
Cations and anions may be represented by dot and cross diagrams showing
the net charge on the ions. It is conventional to show the ‘extra’ electrons on K Cl
an anion using the complementary symbol to its ‘own’ electrons
d) Lattices
Ionic crystals exist as giant (i.e. infinite) lattices (i.e. regular three-dimensional arrays) of ions
e) Ionic bond
An ionic bond is the net strong force of attraction between ions in a lattice. The force (F) between two oppositely
charged ions is proportional to the magnitude of each charge (q) and inversely proportional to the square of the
2
distance (r) between them: F = k.q1.q2 / r
f) Ionic radius
The ionic radius is the distance from the centre of the nucleus to the minimum in the electron density distribution
between two oppositely charged ions in a crystal. The radius of a given type of ion depends on numerous factors but
is roughly constant in a range of environments. Tables of average ionic radii for cations and anions are listed in
reference sources. Cations are smaller than their parent atoms whilst anions are larger. Ionic radii increase down a
+ + +
group (e.g. Li < Na < K ) due to the increasing number of electron shells in the ion. Ionic radii for isoelectronic ions
3- 2- - + 2+ 3+
decrease with increasing atomic number (e.g. N > O > F > Ne > Na > Mg > Al ) due to the increasing nuclear
charge acting on the same number of electrons
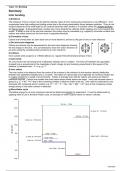
g) Born-Haber cycle
The lattice energy for an ionic compound cannot be determined directly by experiment. It must be determined by
applying Hess’s Law to the Born-Haber cycle, an example of which is given below for calcium chloride.
2500
Ca2+(g) + 2 Cl(g)
2000
2x ∆Hea, Cl = -710 kJ/mol
1500 Ca2+(g) + 2 Cl-(g)
Σ∆Hion, Ca = 1748 kJ/mol
1000
∆H (kJ mol-1)
500 Ca(g) + 2 Cl(g)
2x ∆Hat, Cl = 242 kJ/mol ∆Hlatt, CaCl2 = -2255 kJ/mol
Ca(g) + Cl2(l)
∆Hat, Ca = 178 kJ/mol Ca(l) + Cl2(l)
0
∆Hf, CaCl2 = -796 kJ/mol
-500
CaCl2(s)
-1000
19/05/2009
Summary
Ionic bonding
a) Evidence
The existence of ions is shown by the electron density maps of ionic compounds produced by x-ray diffraction. Ionic
compounds have high melting and boiling points due to the strong electrostatic forces between particles. They do not
conduct electricity in the solid state but do conduct electricity when molten or in solution (when the charged particles
are free to move). During electrolysis, positive ions move towards the cathode whilst negative ions move towards the
anode. If either or both of the ions are coloured, this motion may be visualised (e.g. copper(II) chromate contains blue
cations and yellow anions) as the ions move in opposite directions
b) Formation of ions
Cations are formed when an atom loses one or more electrons; anions by the gain of one or more electrons
c) Dot and cross diagrams -
+
Cations and anions may be represented by dot and cross diagrams showing
the net charge on the ions. It is conventional to show the ‘extra’ electrons on K Cl
an anion using the complementary symbol to its ‘own’ electrons
d) Lattices
Ionic crystals exist as giant (i.e. infinite) lattices (i.e. regular three-dimensional arrays) of ions
e) Ionic bond
An ionic bond is the net strong force of attraction between ions in a lattice. The force (F) between two oppositely
charged ions is proportional to the magnitude of each charge (q) and inversely proportional to the square of the
2
distance (r) between them: F = k.q1.q2 / r
f) Ionic radius
The ionic radius is the distance from the centre of the nucleus to the minimum in the electron density distribution
between two oppositely charged ions in a crystal. The radius of a given type of ion depends on numerous factors but
is roughly constant in a range of environments. Tables of average ionic radii for cations and anions are listed in
reference sources. Cations are smaller than their parent atoms whilst anions are larger. Ionic radii increase down a
+ + +
group (e.g. Li < Na < K ) due to the increasing number of electron shells in the ion. Ionic radii for isoelectronic ions
3- 2- - + 2+ 3+
decrease with increasing atomic number (e.g. N > O > F > Ne > Na > Mg > Al ) due to the increasing nuclear
charge acting on the same number of electrons
g) Born-Haber cycle
The lattice energy for an ionic compound cannot be determined directly by experiment. It must be determined by
applying Hess’s Law to the Born-Haber cycle, an example of which is given below for calcium chloride.
2500
Ca2+(g) + 2 Cl(g)
2000
2x ∆Hea, Cl = -710 kJ/mol
1500 Ca2+(g) + 2 Cl-(g)
Σ∆Hion, Ca = 1748 kJ/mol
1000
∆H (kJ mol-1)
500 Ca(g) + 2 Cl(g)
2x ∆Hat, Cl = 242 kJ/mol ∆Hlatt, CaCl2 = -2255 kJ/mol
Ca(g) + Cl2(l)
∆Hat, Ca = 178 kJ/mol Ca(l) + Cl2(l)
0
∆Hf, CaCl2 = -796 kJ/mol
-500
CaCl2(s)
-1000
19/05/2009