Edexcel A-Level Economics (A)
THEME 2
The UK Economy – Performance
and Policies
STUDENT COMPANION
Author: Geoff Riley
Series Editor: Ruth Tarrant
EDITION DATE: SEPTEMBER 2019
WWW.TUTOR2U.NET/ECONOMICS
,COMPANION CONTENTS
2.1.1 Economic Growth ........................................................................................................................ 3
2.1.2 Inflation ..................................................................................................................................... 11
2.1.3 Employment and Unemployment ............................................................................................. 18
2.1.4 Balance of Payments ................................................................................................................. 27
2.2.1 Aggregate Demand .................................................................................................................... 31
2.2.2 Consumption ............................................................................................................................. 34
2.2.3 Investment ............................................................................................................................. 39
2.2.4 Government spending ............................................................................................................... 43
2.2.5 Net trade (X – M) ....................................................................................................................... 45
2.3.1 Characteristics of aggregate supply........................................................................................... 47
2.3.2 Short run aggregate supply (SRAS) ............................................................................................ 48
2.3.3 Long run aggregate supply (LRAS) ............................................................................................. 50
2.4.1 National Income ........................................................................................................................ 60
2.4.2 Injections and withdrawals........................................................................................................ 64
2.4.3 Equilibrium real national output ............................................................................................... 65
2.4.4 The Multiplier ............................................................................................................................ 68
2.5.1 Causes of Economic Growth ...................................................................................................... 72
2.5.2 Output gaps ............................................................................................................................... 74
2.5.3 Trade (Business) Cycle ............................................................................................................... 76
2.5.4 Impact of economic growth ...................................................................................................... 80
2.6.1 Possible macroeconomic objectives .......................................................................................... 81
2.6.2 Demand side policies ................................................................................................................. 83
2.6.3 Supply-side policies ................................................................................................................. 100
2.6.4 Conflicts and trade-offs between objectives and policies ....................................................... 104
Edexcel A-Level Economics Theme 2 Companion www.tutor2u.net/economics Page 2
SCHOOL LICENCE – Copyright Tutor2u
,2.1.1 Economic Growth
Key specification content:
• Rates of change of real Gross Domestic Product (GDP) as a measure of economic growth
• Distinction between:
o Real and nominal
o Total and per capita, value and volume
• Other national income measures including Gross National Income (GNI)
• Comparison of rates of growth between countries and over time
• Understanding of Purchasing Power Parities (PPPs) and the use of PPP-adjusted figures in international
comparisons
• The limitations of using GDP to compare living standards between countries and over time
o National happiness:
o Measuring economic wellbeing
o The relationship between real incomes and subjective happiness
Measuring Gross Domestic Product
Gross domestic product (GDP) measures the total value of national output of goods & services produced in a given
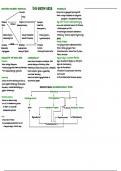
time period (usually a year or per quarter of a year). There are three ways of calculating GDP: Output = Expenditure
(Aggregate Demand) = National Income. We can see all of these methods on a circular flow diagram (which will be
covered later in this course companion), but they are summarised below:
GDP GDP GDP
(Expenditure) (Factor Incomes) (Value of Output)
•Consumption •Incomes for people in jobs and •Value added from each of the
•Government spending in self-employment from their main economic sectors
•Investment spending wages and salaries) •These sectors are
•Change in value of stocks •Profits of private and public •Primary (e.g. farming, fishing &
sector businesses mining)
•Exports
•Rental income from the •Construction
•(minus) Imports
ownership of land •Manufacturing
•= GDP (also known as aggregate
•(Transfer payments are •Tertiary (e.g. tourism)
demand or AD)
excluded)
•AD=C+I+G+X-M •Quaternary (e.g. business
consultancy)
The importance of the concept of value added
GDP can be analysed in terms of the value of output produced by different industries and also by expenditure on
goods and services made by households, businesses and the government. Value added is the increase in market value
of goods or services during each stage of production or supply. So, for example, we can measure the value of wheat
produced by a farmer; we can then measure the additional value as a miller turns the wheat into flour (but we cannot
count the final value of the flour, because this would be ‘double counting’ the value of the original wheat); in turn, we
can then measure the additional value as a baker turns the flour into bread. In summary:
Value added = value of production - value of intermediate inputs used in supplying a good
Edexcel A-Level Economics Theme 2 Companion www.tutor2u.net/economics Page 3
SCHOOL LICENCE – Copyright Tutor2u
, Lower Value Added Industries Higher Value Added Industries
•Textiles •Information technology
•Mass processed foods •Renewable energy
•Farming •Precision engineering
•Manufacturing assembly •Life sciences
•Social care •Aerospace
•Contract cleaning services •Bio-technology
•Security businesses •High class restaurants and hotels
Manufacturing industries
• Manufacturing is a process or business of producing goods in factories.
• In 2018, manufacturing contributed 10 percent of UK GDP and 8 percent of all jobs.
• Manufacturing in the UK has been declining for several decades – this is known as de-industrialisation.
• In other countries such as China, South Korea, Mexico and Germany, manufacturing industries account for a
significantly higher percentage of their countries’ national income.
• The industrial sector of an economy includes manufacturing and construction.
Services
• Services are part of the tertiary sector.
• Examples include business services such as accountancy, health care, education and tourism.
• In 2018, the service sector accounted for 80% of UK output and for 83% of jobs.
• Many manufacturing jobs depend on the demand for and output in service industries e.g. factories that make
the coffee machines, train services that require the manufacturing of carriages and track.
Data in Focus: The UK Construction Industry
In 2017, construction contributed £113 billion worth of output to the UK economy, 6% of the total. There are 2.4 million
construction industry jobs in the UK in 2018, 6.8% of all jobs, despite falls in construction employment in 2009 a bad
2010, and there are now roughly the same number as ten years ago. The construction industry is unusual because of
the high proportion of self-employment in the sector – 37% in 2018, compared to the average for the whole economy
of 13%.
Examiner tip:
It is vital that you have a strong grasp of key features of the UK economy, to help put your exam answers in context.
For the full A level, you should also have a strong awareness of trends and features of other economies, including a
range of developing / emerging economies. This doesn’t mean that you need to memorise lots statistics, but you
should have a firm grasp of key trends.
What is economic growth?
Short run economic growth is the increase in the real value of goods and services produced and is measured by the
annual percentage change in real Gross Domestic Product (GDP). Long run economic growth is an increase in a
country’s productive capacity / potential output
The chart below shows the annual rate of growth for the UK economy since 2008. 2009 was a year of recession when
the real value of national output contracted by over 4%.
Edexcel A-Level Economics Theme 2 Companion www.tutor2u.net/economics Page 4
SCHOOL LICENCE – Copyright Tutor2u
THEME 2
The UK Economy – Performance
and Policies
STUDENT COMPANION
Author: Geoff Riley
Series Editor: Ruth Tarrant
EDITION DATE: SEPTEMBER 2019
WWW.TUTOR2U.NET/ECONOMICS
,COMPANION CONTENTS
2.1.1 Economic Growth ........................................................................................................................ 3
2.1.2 Inflation ..................................................................................................................................... 11
2.1.3 Employment and Unemployment ............................................................................................. 18
2.1.4 Balance of Payments ................................................................................................................. 27
2.2.1 Aggregate Demand .................................................................................................................... 31
2.2.2 Consumption ............................................................................................................................. 34
2.2.3 Investment ............................................................................................................................. 39
2.2.4 Government spending ............................................................................................................... 43
2.2.5 Net trade (X – M) ....................................................................................................................... 45
2.3.1 Characteristics of aggregate supply........................................................................................... 47
2.3.2 Short run aggregate supply (SRAS) ............................................................................................ 48
2.3.3 Long run aggregate supply (LRAS) ............................................................................................. 50
2.4.1 National Income ........................................................................................................................ 60
2.4.2 Injections and withdrawals........................................................................................................ 64
2.4.3 Equilibrium real national output ............................................................................................... 65
2.4.4 The Multiplier ............................................................................................................................ 68
2.5.1 Causes of Economic Growth ...................................................................................................... 72
2.5.2 Output gaps ............................................................................................................................... 74
2.5.3 Trade (Business) Cycle ............................................................................................................... 76
2.5.4 Impact of economic growth ...................................................................................................... 80
2.6.1 Possible macroeconomic objectives .......................................................................................... 81
2.6.2 Demand side policies ................................................................................................................. 83
2.6.3 Supply-side policies ................................................................................................................. 100
2.6.4 Conflicts and trade-offs between objectives and policies ....................................................... 104
Edexcel A-Level Economics Theme 2 Companion www.tutor2u.net/economics Page 2
SCHOOL LICENCE – Copyright Tutor2u
,2.1.1 Economic Growth
Key specification content:
• Rates of change of real Gross Domestic Product (GDP) as a measure of economic growth
• Distinction between:
o Real and nominal
o Total and per capita, value and volume
• Other national income measures including Gross National Income (GNI)
• Comparison of rates of growth between countries and over time
• Understanding of Purchasing Power Parities (PPPs) and the use of PPP-adjusted figures in international
comparisons
• The limitations of using GDP to compare living standards between countries and over time
o National happiness:
o Measuring economic wellbeing
o The relationship between real incomes and subjective happiness
Measuring Gross Domestic Product
Gross domestic product (GDP) measures the total value of national output of goods & services produced in a given
time period (usually a year or per quarter of a year). There are three ways of calculating GDP: Output = Expenditure
(Aggregate Demand) = National Income. We can see all of these methods on a circular flow diagram (which will be
covered later in this course companion), but they are summarised below:
GDP GDP GDP
(Expenditure) (Factor Incomes) (Value of Output)
•Consumption •Incomes for people in jobs and •Value added from each of the
•Government spending in self-employment from their main economic sectors
•Investment spending wages and salaries) •These sectors are
•Change in value of stocks •Profits of private and public •Primary (e.g. farming, fishing &
sector businesses mining)
•Exports
•Rental income from the •Construction
•(minus) Imports
ownership of land •Manufacturing
•= GDP (also known as aggregate
•(Transfer payments are •Tertiary (e.g. tourism)
demand or AD)
excluded)
•AD=C+I+G+X-M •Quaternary (e.g. business
consultancy)
The importance of the concept of value added
GDP can be analysed in terms of the value of output produced by different industries and also by expenditure on
goods and services made by households, businesses and the government. Value added is the increase in market value
of goods or services during each stage of production or supply. So, for example, we can measure the value of wheat
produced by a farmer; we can then measure the additional value as a miller turns the wheat into flour (but we cannot
count the final value of the flour, because this would be ‘double counting’ the value of the original wheat); in turn, we
can then measure the additional value as a baker turns the flour into bread. In summary:
Value added = value of production - value of intermediate inputs used in supplying a good
Edexcel A-Level Economics Theme 2 Companion www.tutor2u.net/economics Page 3
SCHOOL LICENCE – Copyright Tutor2u
, Lower Value Added Industries Higher Value Added Industries
•Textiles •Information technology
•Mass processed foods •Renewable energy
•Farming •Precision engineering
•Manufacturing assembly •Life sciences
•Social care •Aerospace
•Contract cleaning services •Bio-technology
•Security businesses •High class restaurants and hotels
Manufacturing industries
• Manufacturing is a process or business of producing goods in factories.
• In 2018, manufacturing contributed 10 percent of UK GDP and 8 percent of all jobs.
• Manufacturing in the UK has been declining for several decades – this is known as de-industrialisation.
• In other countries such as China, South Korea, Mexico and Germany, manufacturing industries account for a
significantly higher percentage of their countries’ national income.
• The industrial sector of an economy includes manufacturing and construction.
Services
• Services are part of the tertiary sector.
• Examples include business services such as accountancy, health care, education and tourism.
• In 2018, the service sector accounted for 80% of UK output and for 83% of jobs.
• Many manufacturing jobs depend on the demand for and output in service industries e.g. factories that make
the coffee machines, train services that require the manufacturing of carriages and track.
Data in Focus: The UK Construction Industry
In 2017, construction contributed £113 billion worth of output to the UK economy, 6% of the total. There are 2.4 million
construction industry jobs in the UK in 2018, 6.8% of all jobs, despite falls in construction employment in 2009 a bad
2010, and there are now roughly the same number as ten years ago. The construction industry is unusual because of
the high proportion of self-employment in the sector – 37% in 2018, compared to the average for the whole economy
of 13%.
Examiner tip:
It is vital that you have a strong grasp of key features of the UK economy, to help put your exam answers in context.
For the full A level, you should also have a strong awareness of trends and features of other economies, including a
range of developing / emerging economies. This doesn’t mean that you need to memorise lots statistics, but you
should have a firm grasp of key trends.
What is economic growth?
Short run economic growth is the increase in the real value of goods and services produced and is measured by the
annual percentage change in real Gross Domestic Product (GDP). Long run economic growth is an increase in a
country’s productive capacity / potential output
The chart below shows the annual rate of growth for the UK economy since 2008. 2009 was a year of recession when
the real value of national output contracted by over 4%.
Edexcel A-Level Economics Theme 2 Companion www.tutor2u.net/economics Page 4
SCHOOL LICENCE – Copyright Tutor2u