Paper 3- Investigation skills Qs June 2023
1(a). Ecologists were studying an area that contained three different habitats. The area is shown in the diagram below.
The ecologists sampled the area to estimate insect biodiversity.
Describe how the ecologists should choose the number and locations of their samples to ensure that the sampling is representative.
Use a calculation to support your answer.
[3]
(b). Ecologists sampled an area to estimate insect biodiversity.
Two of the insect species that were sampled were the large heath butterfly and the bog hoverfly.
The ecologists used the capture-mark-recapture technique and estimated population sizes using two different calculations: the Lincoln
estimate and the Chapman estimate.
i. Calculate the population sizes of the two insect species using each of the formulae below.
Write your answers in the table.
Lincoln estimate formula:
Chapman estimate formula:
n = number of individuals in a particular sample
m = number of marked individuals in the second sample
Number of Population estimate (number of
Number captured individuals)
Total number in marked
Species and marked in
sample 2 individuals in Chapman
sample 1 Lincoln estimate
sample 2 estimate
large heath 77 73 4
butterfly
5 6 1
© OCR 2023. You may photocopy this Page 1 of 26 Created in ExamBuilder
page.
, bog
hoverfly
[2]
ii. The Lincoln and Chapman formulae give different estimates for population size.
Give two further conclusions about the difference in population estimates given by the Lincoln and Chapman formulae.
1
2
[2]
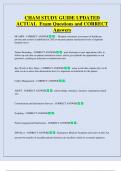
2. Haemocyanin is an oxygen-binding pigment that is found in many invertebrate animals, including lobsters.
Fig. 6.2 shows the oxygen dissociation curves for haemoglobin and haemocyanin.
Fig. 6.2
What can you conclude about the habitat of a lobster?
[1]
3(a). Students investigated the effect of light on the growth of garden cress seedlings.
• A total of 120 seedlings were divided into 2 groups of 60.
• Group A was grown in darkness for 2 days.
• Group B was grown for 1 day in darkness and then for 1 day in white light using the set-up shown in Fig. 3.1.
Fig. 3.1
© OCR 2023. You may photocopy this Page 2 of 26 Created in ExamBuilder
page.
, The results of the students’ experiment are shown in Tables 3.1 and 3.2.
Mean length (mm) Mean mass (μg)
Group
stem root stem root
A 13 18 102 60
B 25 23 160 120
Table 3.1
Number of seedlings
Direction of growth in Group B stem root
Away from light 2 29
Neither away from nor towards light 3 20
Towards light 55 11
Table 3.2
i. * Describe and explain the results shown in Tables 3.1 and 3.2.
© OCR 2023. You may photocopy this Page 3 of 26 Created in ExamBuilder
page.
1(a). Ecologists were studying an area that contained three different habitats. The area is shown in the diagram below.
The ecologists sampled the area to estimate insect biodiversity.
Describe how the ecologists should choose the number and locations of their samples to ensure that the sampling is representative.
Use a calculation to support your answer.
[3]
(b). Ecologists sampled an area to estimate insect biodiversity.
Two of the insect species that were sampled were the large heath butterfly and the bog hoverfly.
The ecologists used the capture-mark-recapture technique and estimated population sizes using two different calculations: the Lincoln
estimate and the Chapman estimate.
i. Calculate the population sizes of the two insect species using each of the formulae below.
Write your answers in the table.
Lincoln estimate formula:
Chapman estimate formula:
n = number of individuals in a particular sample
m = number of marked individuals in the second sample
Number of Population estimate (number of
Number captured individuals)
Total number in marked
Species and marked in
sample 2 individuals in Chapman
sample 1 Lincoln estimate
sample 2 estimate
large heath 77 73 4
butterfly
5 6 1
© OCR 2023. You may photocopy this Page 1 of 26 Created in ExamBuilder
page.
, bog
hoverfly
[2]
ii. The Lincoln and Chapman formulae give different estimates for population size.
Give two further conclusions about the difference in population estimates given by the Lincoln and Chapman formulae.
1
2
[2]
2. Haemocyanin is an oxygen-binding pigment that is found in many invertebrate animals, including lobsters.
Fig. 6.2 shows the oxygen dissociation curves for haemoglobin and haemocyanin.
Fig. 6.2
What can you conclude about the habitat of a lobster?
[1]
3(a). Students investigated the effect of light on the growth of garden cress seedlings.
• A total of 120 seedlings were divided into 2 groups of 60.
• Group A was grown in darkness for 2 days.
• Group B was grown for 1 day in darkness and then for 1 day in white light using the set-up shown in Fig. 3.1.
Fig. 3.1
© OCR 2023. You may photocopy this Page 2 of 26 Created in ExamBuilder
page.
, The results of the students’ experiment are shown in Tables 3.1 and 3.2.
Mean length (mm) Mean mass (μg)
Group
stem root stem root
A 13 18 102 60
B 25 23 160 120
Table 3.1
Number of seedlings
Direction of growth in Group B stem root
Away from light 2 29
Neither away from nor towards light 3 20
Towards light 55 11
Table 3.2
i. * Describe and explain the results shown in Tables 3.1 and 3.2.
© OCR 2023. You may photocopy this Page 3 of 26 Created in ExamBuilder
page.