Binomial Distributions
The Binomial Probability Function
P (r successes in n trials) = nCr x pr x (p-1)n-r
Conditions for a Binomial Distribution
1. All trials are independent
2. The probability of success is the same in each trial
3. There is a fixed number of trials
4. Each result is either a ‘success’ or ‘failure’
5. The variable is the total number of successes in the trials
The Binomial Distribution
If the above conditions are satisfied then P (X = x) = nCx x px x (1-p)n-x, which can be written as X ~ B (n,p)
• The expected number of successes is given by n x p
• Use the ‘probability distribution function’ on the calculator to find P (X = x)
• Use the ‘cumulative distribution function’ on the calculator to find P (X ≤ x)
o P (X < x) = P (X ≤ x-1)
o P (X > x) = 1 - P (X ≤ x)
o P (X ≥ x) = 1 - P (X ≤ x-1)
Normal Distributions
The Normal Distribution
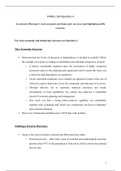
If X is normally distributed with mean µ and variance σ2, it is written as X ~ N (µ,σ2)
• Approx. 2/3 of the data lie within one standard
deviation of the mean
• Approx. 95% of the data lies within two
standard deviations of the mean
• Approx. 99.7% of the data lies within three
standard deviations of the mean
• There are points of inflection at x = µ ± σ
• The probability of the random variable taking a value between 2 limits is the area under the graph
between those limits
• The graph is symmetrical, so values the same distance above and below the mean are equal
• For a continuous variable, P (X ≤ k) = P (X < k)
The Binomial Probability Function
P (r successes in n trials) = nCr x pr x (p-1)n-r
Conditions for a Binomial Distribution
1. All trials are independent
2. The probability of success is the same in each trial
3. There is a fixed number of trials
4. Each result is either a ‘success’ or ‘failure’
5. The variable is the total number of successes in the trials
The Binomial Distribution
If the above conditions are satisfied then P (X = x) = nCx x px x (1-p)n-x, which can be written as X ~ B (n,p)
• The expected number of successes is given by n x p
• Use the ‘probability distribution function’ on the calculator to find P (X = x)
• Use the ‘cumulative distribution function’ on the calculator to find P (X ≤ x)
o P (X < x) = P (X ≤ x-1)
o P (X > x) = 1 - P (X ≤ x)
o P (X ≥ x) = 1 - P (X ≤ x-1)
Normal Distributions
The Normal Distribution
If X is normally distributed with mean µ and variance σ2, it is written as X ~ N (µ,σ2)
• Approx. 2/3 of the data lie within one standard
deviation of the mean
• Approx. 95% of the data lies within two
standard deviations of the mean
• Approx. 99.7% of the data lies within three
standard deviations of the mean
• There are points of inflection at x = µ ± σ
• The probability of the random variable taking a value between 2 limits is the area under the graph
between those limits
• The graph is symmetrical, so values the same distance above and below the mean are equal
• For a continuous variable, P (X ≤ k) = P (X < k)