Inferential testing:
Key words:-
● Parametric = a powerful test, as it uses interval data
● Non-parametric = a hypothesis test that does not make any assumptions
The sign test:
Used when difference is predicted between two sets of data. It asses the direction and
strength of any difference between the scores
- Test of difference
- Data is nominal
- Repeated measures and (usually) can be matched pairs
- Non parametric
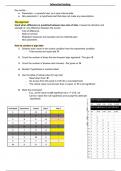
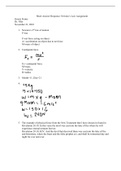
How to conduct a sign test:-
1. Subtract each value in the control condition from the experiment condition
- If two scores are equal add ‘0’
2. Count the number of times the less frequent sign appeared. This give ‘S’
3. Count the number of plusses and minuses - this gives us ‘N’
4. Decide if hypothesis is one/two-tailed
5. Use the table of critical value for sign test
- Read down from ‘N’
- Go across from this point to 0.05 (for a one-tailed test)
- The critical value must be less than or equal to ‘S’ to be significant
6. State the conclusion.
- E.g., as the result is not significant at p => 0.05, we
Cannot reject the null hypothesis and accept the alternate
hypothesis
, Probability and significance:
hypothesis testing:-
- Psychologists want to be able to generalise their findings to a larger population
- Studies are carried out by Hypotheses:
● Null hypothesis - ‘there will be no difference between the two variables’
● Alternative - ‘there is a relationship between the two variables’
Key words:-
● Variability = the researcher must decide if the data collected is strong enough before
rejecting the null and accepting the alternative hypothesis. The researchers sue
probability to minimise the chance that they reject the null and accept the alternative
hypothesis in error due to natural variability
● Significance level = usually 5% of less
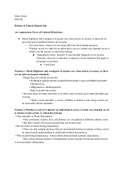
Probability and significance:
- If we find a significant results we can accept the alternative hypothesis
Expression: Interpretation: Meaning:
p < 0.05 The probability the difference occurred by Result is significant
chance is less than 0.05 (5%)
p = 0.05 The difference occurred by chase is equal to Result is significant
0.05
p > 0.05 The difference occurred by chance is more Result is not significant
than 0.05
p =< 0.01 The difference occurred by chance is less Result is significant
than/equal to 0.05
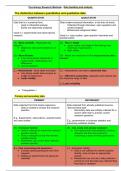
Type I and Type II errors:
TYPE I error TYPE II error
● ‘False positive’ ● ‘False negative’
Rejecting the null hypothesis and Accepting the null hypothesis and
accepting the alternative hypothesis, rejecting the alternate, even though
even through findings were due to the hypothesis is correct
chance
Data collected has passed Data collected has not passed
The level of significance the level of significance
Reduce the chance of Type I error:-
Researcher can decide to use p =< 0.01 level of significance (however this can cause type ii
error)
- To reduce type ii error you use p =< 0.05 (but this causes type i error)
Key words:-
● Parametric = a powerful test, as it uses interval data
● Non-parametric = a hypothesis test that does not make any assumptions
The sign test:
Used when difference is predicted between two sets of data. It asses the direction and
strength of any difference between the scores
- Test of difference
- Data is nominal
- Repeated measures and (usually) can be matched pairs
- Non parametric
How to conduct a sign test:-
1. Subtract each value in the control condition from the experiment condition
- If two scores are equal add ‘0’
2. Count the number of times the less frequent sign appeared. This give ‘S’
3. Count the number of plusses and minuses - this gives us ‘N’
4. Decide if hypothesis is one/two-tailed
5. Use the table of critical value for sign test
- Read down from ‘N’
- Go across from this point to 0.05 (for a one-tailed test)
- The critical value must be less than or equal to ‘S’ to be significant
6. State the conclusion.
- E.g., as the result is not significant at p => 0.05, we
Cannot reject the null hypothesis and accept the alternate
hypothesis
, Probability and significance:
hypothesis testing:-
- Psychologists want to be able to generalise their findings to a larger population
- Studies are carried out by Hypotheses:
● Null hypothesis - ‘there will be no difference between the two variables’
● Alternative - ‘there is a relationship between the two variables’
Key words:-
● Variability = the researcher must decide if the data collected is strong enough before
rejecting the null and accepting the alternative hypothesis. The researchers sue
probability to minimise the chance that they reject the null and accept the alternative
hypothesis in error due to natural variability
● Significance level = usually 5% of less
Probability and significance:
- If we find a significant results we can accept the alternative hypothesis
Expression: Interpretation: Meaning:
p < 0.05 The probability the difference occurred by Result is significant
chance is less than 0.05 (5%)
p = 0.05 The difference occurred by chase is equal to Result is significant
0.05
p > 0.05 The difference occurred by chance is more Result is not significant
than 0.05
p =< 0.01 The difference occurred by chance is less Result is significant
than/equal to 0.05
Type I and Type II errors:
TYPE I error TYPE II error
● ‘False positive’ ● ‘False negative’
Rejecting the null hypothesis and Accepting the null hypothesis and
accepting the alternative hypothesis, rejecting the alternate, even though
even through findings were due to the hypothesis is correct
chance
Data collected has passed Data collected has not passed
The level of significance the level of significance
Reduce the chance of Type I error:-
Researcher can decide to use p =< 0.01 level of significance (however this can cause type ii
error)
- To reduce type ii error you use p =< 0.05 (but this causes type i error)