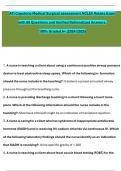
When writing a method remember:
Design
Apparatus
Procedure
word search with sweet
word search without sweet
1
2
3
4
5
6
7
Graphs
* must be labelled, operationalised, titled and to scale
* A ruler must be used
* Correlation graphs are lines of best fit
* Tables must be titled and neat
* Pie charts are unlikely you may be asked to draw but may be asked to read the
data from this
* Interval data is used because the results follow on from each other
, Correlations
* can only run from -1 to +1
* -1 is a very strong negative
* +1 is a very strong positive
* No IV or DV
Inferential statistics
* stats tests are used to show whether the hypothesis can be accepted
* It shows whether the results are significant or due to chance
* Shows probability and if the experiment is repeated, would the results be the
same
* 95/100 to be significant
Significance
* we may found that people learn more words and have a better memory recall when
they listen to classical music
* It may have been a fluke; the result of chance in who we asked and the day they
did the test
* To check our results are not due to chance we need to find out if they are
significant and to do this we do a statistical test
* Level of 5% is accepted (0.05)
Descriptive statistics
* pie chart
* Histogram
* Scattergram
* Bar graph
* Table
Types of data
* ordinal (ranked)
* Nominal (categorical)
* Interval (quantifiable)
Experimental designs
* repeated measure (all conditions)
* Independent group (only do 1 condition)
* Matched pairs (matched upon certain criteria)
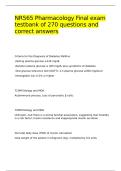
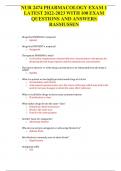
repeated measures/ matched pairs
independent
correlation
nominal
sign (Simon)
chi sq (χ2) (Cowell)
x
ordinal
wilcoxon (wants)
Design
Apparatus
Procedure
word search with sweet
word search without sweet
1
2
3
4
5
6
7
Graphs
* must be labelled, operationalised, titled and to scale
* A ruler must be used
* Correlation graphs are lines of best fit
* Tables must be titled and neat
* Pie charts are unlikely you may be asked to draw but may be asked to read the
data from this
* Interval data is used because the results follow on from each other
, Correlations
* can only run from -1 to +1
* -1 is a very strong negative
* +1 is a very strong positive
* No IV or DV
Inferential statistics
* stats tests are used to show whether the hypothesis can be accepted
* It shows whether the results are significant or due to chance
* Shows probability and if the experiment is repeated, would the results be the
same
* 95/100 to be significant
Significance
* we may found that people learn more words and have a better memory recall when
they listen to classical music
* It may have been a fluke; the result of chance in who we asked and the day they
did the test
* To check our results are not due to chance we need to find out if they are
significant and to do this we do a statistical test
* Level of 5% is accepted (0.05)
Descriptive statistics
* pie chart
* Histogram
* Scattergram
* Bar graph
* Table
Types of data
* ordinal (ranked)
* Nominal (categorical)
* Interval (quantifiable)
Experimental designs
* repeated measure (all conditions)
* Independent group (only do 1 condition)
* Matched pairs (matched upon certain criteria)
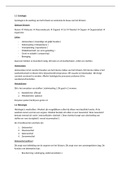
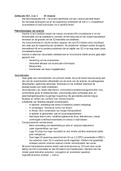
repeated measures/ matched pairs
independent
correlation
nominal
sign (Simon)
chi sq (χ2) (Cowell)
x
ordinal
wilcoxon (wants)