Statistiek 1B
Statistical methods for the Social Sciences
Hoofdstuk 4 t/m 8
Hoofdstuk 4
4.1 Introduction to probablity
Probability (kans): De kans/probabilty van een waarde is het aantal keer dat die waarde
voorkomt wanneer er oneindig veel metingen worden gedaan. Kans wordt gebaseerd op long run
(lange termijn), omdat je een groot aantal metingen nodig hebt om de kans juist vast te stellen.
Een wiskundig kansmodel P, kent aan iedere waarde A een kans P(A) toe. De kans ligt
altijd tussen 0 en 1 (relatieve frequentie). De uitkomstruimte (=S/ sample size) is de verzameling van
alle mogelijke uitkomsten van hetzelfde toevalsverschijnsel.
Bijv. S= {1,2,3,4,5,6} bij een worp met een dobbelsteen.
De kans dat er 1 wordt gegooid is P(1)= 1/6 = 0.1666 (=16.66%)
De kans op een even aantal ogen is P(2,4,6) = 3/6 = 0.5 (=50%)
Kansen geef je nooit in procenten!
Verzamelingenleer: Sample size
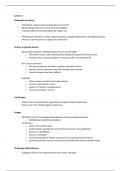
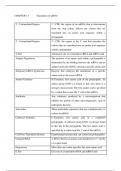
- A c B A is een deelverzameling van B
Dan geldt P(A) ≤ P(B) B A
Bijv. B= {1,3,5) oneven getallen dobbelsteen.
A= {3} worp van een 3 met een dobbelsteen.
P(A)= 1/6 ≤ ½ = P(B)
Venn-diagram A c B
In een Venn-diagram kan men kansen (P(A)) verbeelden door de oppervlakte van
cirker/ovaal/rechthoek A.
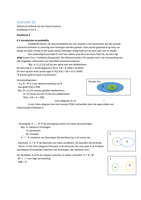
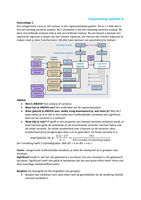
- Vereniging: A B de vereniging (union) van twee verzamelingen.
Bijv. S= inwoners Groningen
A= werklozen
B= vrouwen S
A B: Inwoners van Groningen die werkloos (en-) of vrouw zijn.
A B
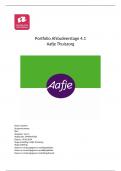
- Doorsnee: A ∩ B de doorsnee van twee variabelen. De waarden die bij beide
horen. In het Venn-diagram hiernaast is de doorsnee het stuk waar A en B elkaar
overlappen (Vrouwelijke inwoners van Groningen, die werkloos zijn).
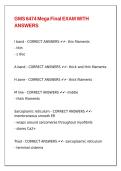
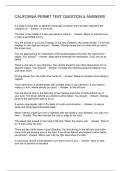
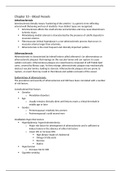
De variabelen A en B zijn disjunct wanneer ze elkaar uitsluiten: A ∩ B = Ø
Ø = { } = een lege verzameling. S
P(Ø) = 0.
B
A
Statistical methods for the Social Sciences
Hoofdstuk 4 t/m 8
Hoofdstuk 4
4.1 Introduction to probablity
Probability (kans): De kans/probabilty van een waarde is het aantal keer dat die waarde
voorkomt wanneer er oneindig veel metingen worden gedaan. Kans wordt gebaseerd op long run
(lange termijn), omdat je een groot aantal metingen nodig hebt om de kans juist vast te stellen.
Een wiskundig kansmodel P, kent aan iedere waarde A een kans P(A) toe. De kans ligt
altijd tussen 0 en 1 (relatieve frequentie). De uitkomstruimte (=S/ sample size) is de verzameling van
alle mogelijke uitkomsten van hetzelfde toevalsverschijnsel.
Bijv. S= {1,2,3,4,5,6} bij een worp met een dobbelsteen.
De kans dat er 1 wordt gegooid is P(1)= 1/6 = 0.1666 (=16.66%)
De kans op een even aantal ogen is P(2,4,6) = 3/6 = 0.5 (=50%)
Kansen geef je nooit in procenten!
Verzamelingenleer: Sample size
- A c B A is een deelverzameling van B
Dan geldt P(A) ≤ P(B) B A
Bijv. B= {1,3,5) oneven getallen dobbelsteen.
A= {3} worp van een 3 met een dobbelsteen.
P(A)= 1/6 ≤ ½ = P(B)
Venn-diagram A c B
In een Venn-diagram kan men kansen (P(A)) verbeelden door de oppervlakte van
cirker/ovaal/rechthoek A.
- Vereniging: A B de vereniging (union) van twee verzamelingen.
Bijv. S= inwoners Groningen
A= werklozen
B= vrouwen S
A B: Inwoners van Groningen die werkloos (en-) of vrouw zijn.
A B
- Doorsnee: A ∩ B de doorsnee van twee variabelen. De waarden die bij beide
horen. In het Venn-diagram hiernaast is de doorsnee het stuk waar A en B elkaar
overlappen (Vrouwelijke inwoners van Groningen, die werkloos zijn).
De variabelen A en B zijn disjunct wanneer ze elkaar uitsluiten: A ∩ B = Ø
Ø = { } = een lege verzameling. S
P(Ø) = 0.
B
A