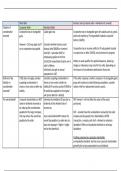
Introduction
Scientific Method
Theory
- An explanation for a set of observations
- Too vague to test directly
- example: frustration can cause aggression
Hypothesis
- A prediction derived from the theory
- Can be tested directly
- example: if I deprive kids from getting candy they will become aggressive
Operational Definition
- To define all terms and procedures so that the study can be replicated
- A theory cannot be proved, only confirmed
The scientific method
Theory (explaining observations) - Hypothesis (specific prediction) - Operational Definition
(test hypothesis)
If the hypothesis is supported, the confidence in the theory increases
If the hypothesis is NOT supported, the confidence in the theory decreases which means it
needs to be revised or discarded
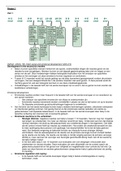
Research Methods
- What we know about behavior was derived from empirical research
- The method of research depends on your question
- Each method has advantages and disadvantages
Survey Method
- Information based on attitude or behavior usually results in a questionnaire
Advantages
- Tests a large group quick
- Cheap and practical
- Anonymous so usually honest answers
Disadvantages
- Need a large sample
- Can misinterpret questions
- Not sure if people are answering honestly
,The population is the group of interest
The sample is the smaller group that you study
- To generalize from the sample to the population, the sample must be representative
of the population (“mini-version”)
- That is achieved through random sampling
- Random sampling: putting everyone's name in a hat one time and the probability of
your name getting chosen is equal to everyone else
Naturalistic Observation
- Used when uninterested in describing or measuring natural behavior in a natural
setting
Advantage
- People behave naturally (generalize findings)
Disadvantages
- Experimenter has little to no control over the situation
- You can't infer (cause and effect)
- Experimenter could bias opinions
- Ethical considerations
Experimentation
- Some variables are manipulated while others are controlled
- A variable is something you can change (example: an alcohol drink, an amount of a
drink, the type of person someone is, time of day, etc.)
Advantages
- You can infer (cause and effect)
- You can control over the situation and variables
Disadvantage
- Studies may not behave naturally
Independent variable (IV) CAUSE
- The variable that is manipulated or changed to see if it has an affect on the behavior
Dependant variable (DV) EFFECT
- The measured behavior to see if IV has an effect
- Studies usually have one more IV and DV
Control Group
- The group used as stranded for comparison
- The group gets the “0” amount of the IV
Experimental group
- Any group besides the control group
- Similar to control group except for IV
Placebo Control Group
, - Used in drug-related studies
- Special type of control group
- Controls subjects expectations that could affect results
Confounding Variable
- Something you don't want
- Interferes with results of the study
- Changes with IV
- Can affect DV
- You don't know whether the effects are caused by the IV, the confounding variable, or
both
Random Assign Groups
- Randomly assign subjects to different groups
- “Individual differences” are evenly distributed
- Makes groups equal except for IV
Correlation Method
- Two variables are related
- No attempt to manipulate or control
- Naturally occurring variations in both variables
- Correlations help make predictions
Positive Correlation: the value of both variables change in the SAME direction (as
the value of one variable increases the value of the other variable also increases).
Negative Correlation: the value of both variables changes in the OPPOSITE
direction (as the value of one variable increases the value of the other variable
decreases).
Scatterplot
- A graph to show correlation data
- You can't infer (cause and effect)
- You don't manipulate variables and control others
Experimenter Expectancy Effects
- Has a hypothesis and expects certain results or outcomes
Double-Blind Procedure
- The subject and experimenter don't know the hypothesis
- Reduces the chances of expectancy effects
Pilot Study
- Only a few subjects
- Resolve any unforeseen problems
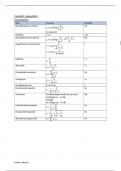
Statistics
Scientific Method
Theory
- An explanation for a set of observations
- Too vague to test directly
- example: frustration can cause aggression
Hypothesis
- A prediction derived from the theory
- Can be tested directly
- example: if I deprive kids from getting candy they will become aggressive
Operational Definition
- To define all terms and procedures so that the study can be replicated
- A theory cannot be proved, only confirmed
The scientific method
Theory (explaining observations) - Hypothesis (specific prediction) - Operational Definition
(test hypothesis)
If the hypothesis is supported, the confidence in the theory increases
If the hypothesis is NOT supported, the confidence in the theory decreases which means it
needs to be revised or discarded
Research Methods
- What we know about behavior was derived from empirical research
- The method of research depends on your question
- Each method has advantages and disadvantages
Survey Method
- Information based on attitude or behavior usually results in a questionnaire
Advantages
- Tests a large group quick
- Cheap and practical
- Anonymous so usually honest answers
Disadvantages
- Need a large sample
- Can misinterpret questions
- Not sure if people are answering honestly
,The population is the group of interest
The sample is the smaller group that you study
- To generalize from the sample to the population, the sample must be representative
of the population (“mini-version”)
- That is achieved through random sampling
- Random sampling: putting everyone's name in a hat one time and the probability of
your name getting chosen is equal to everyone else
Naturalistic Observation
- Used when uninterested in describing or measuring natural behavior in a natural
setting
Advantage
- People behave naturally (generalize findings)
Disadvantages
- Experimenter has little to no control over the situation
- You can't infer (cause and effect)
- Experimenter could bias opinions
- Ethical considerations
Experimentation
- Some variables are manipulated while others are controlled
- A variable is something you can change (example: an alcohol drink, an amount of a
drink, the type of person someone is, time of day, etc.)
Advantages
- You can infer (cause and effect)
- You can control over the situation and variables
Disadvantage
- Studies may not behave naturally
Independent variable (IV) CAUSE
- The variable that is manipulated or changed to see if it has an affect on the behavior
Dependant variable (DV) EFFECT
- The measured behavior to see if IV has an effect
- Studies usually have one more IV and DV
Control Group
- The group used as stranded for comparison
- The group gets the “0” amount of the IV
Experimental group
- Any group besides the control group
- Similar to control group except for IV
Placebo Control Group
, - Used in drug-related studies
- Special type of control group
- Controls subjects expectations that could affect results
Confounding Variable
- Something you don't want
- Interferes with results of the study
- Changes with IV
- Can affect DV
- You don't know whether the effects are caused by the IV, the confounding variable, or
both
Random Assign Groups
- Randomly assign subjects to different groups
- “Individual differences” are evenly distributed
- Makes groups equal except for IV
Correlation Method
- Two variables are related
- No attempt to manipulate or control
- Naturally occurring variations in both variables
- Correlations help make predictions
Positive Correlation: the value of both variables change in the SAME direction (as
the value of one variable increases the value of the other variable also increases).
Negative Correlation: the value of both variables changes in the OPPOSITE
direction (as the value of one variable increases the value of the other variable
decreases).
Scatterplot
- A graph to show correlation data
- You can't infer (cause and effect)
- You don't manipulate variables and control others
Experimenter Expectancy Effects
- Has a hypothesis and expects certain results or outcomes
Double-Blind Procedure
- The subject and experimenter don't know the hypothesis
- Reduces the chances of expectancy effects
Pilot Study
- Only a few subjects
- Resolve any unforeseen problems
Statistics