Exam (elaborations)
Text_Analytics_Week11_NEC_Solved
Rating
Sold
1
Pages
7
Grade
A+
Uploaded on
18-04-2023
Written in
2022/2023
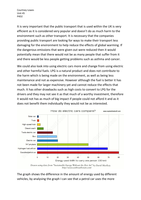
1. Show stacked bar charts of the most common terms within each of 2 topics from the Associated Press articles in the topicmodels package. Color the charts by topic. Comment your code line by line. 2. Show a stacked bar chart showing the words that have a Beta greater than 1/1000 in at least one topic with the greatest difference in Beta between topic 1 and topic 2. comment each line of your code.
Show more
Read less
Institution
Text Analytics
Course
Text Analytics
Whoops! We can’t load your doc right now. Try again or contact support.
Connected book
Written for
- Institution
- Text Analytics
- Course
- Text Analytics
Document information
- Uploaded on
- April 18, 2023
- File latest updated on
- May 29, 2023
- Number of pages
- 7
- Written in
- 2022/2023
- Type
- Exam (elaborations)
- Contains
- Questions & answers
Subjects
-
textanalyticsweek11necsolved
$10.99
Get access to the full document:
Wrong document? Swap it for free
Within 14 days of purchase and before downloading, you can choose a different document. You can simply spend the amount again.
Written by students who passed
Immediately available after payment
Read online or as PDF
Also available in package deal
Package deal
TextAnalytics_NEC_All_Weeks_Solved
1
13
2023
$ 142.87
More info