Exam (elaborations)
TextAnalytics_Week3_NEC_solved
Rating
Sold
-
Pages
5
Grade
A+
Uploaded on
18-04-2023
Written in
2022/2023
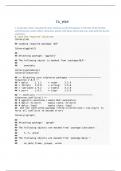
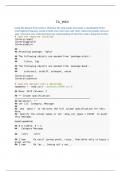
Using the dataset from week 2, eliminate the stop words and create a visualization of the highest frequency words in both a bar chart and a pie chart. Label your graphs and your axes. Comment your code showing your understanding of what the code is doing line by line.
Show more
Read less
Institution
Text Analytics
Course
Text Analytics
Whoops! We can’t load your doc right now. Try again or contact support.
Connected book
Written for
- Institution
- Text Analytics
- Course
- Text Analytics
Document information
- Uploaded on
- April 18, 2023
- File latest updated on
- July 18, 2023
- Number of pages
- 5
- Written in
- 2022/2023
- Type
- Exam (elaborations)
- Contains
- Questions & answers
Subjects
-
textanalyticsweek3necsolved
$10.99
Get access to the full document:
Wrong document? Swap it for free
Within 14 days of purchase and before downloading, you can choose a different document. You can simply spend the amount again.
Written by students who passed
Immediately available after payment
Read online or as PDF
Also available in package deal
Package deal
TextAnalytics_NEC_All_Weeks_Solved
1
13
2023
$ 142.87
More info