Visual_Analytics_Week4_NEC_Solved
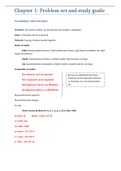
Show meta data from the mpg dataframe using summary(). Show metadata from the gapminder dataframe assign ggplot(data = gapminder, mapping = aes(x = gdpPercap, y = lifeExp) to the variable 'p' find the structure of the p object. add () to the p object. Show p. replace () with h(). Show p. return to and add h(). Show p. add the linear element to the h function. Show p. change the x axis scare to log10. Show p. try scale_y_log10(). Show p. change the method to gam from lm. Show p. replace scientific notation on the x axis with dollar signs identify the continent of each point with color. Show p. add labels to the plot. Show p. change the method to loess. Show p. use fill to change the appearace of lines, points, and the interior of the smoother's standard error ribbon. S thehow p. limit the figure size in R markdown to 8 x 5. save one of your plots in it's own file. experiment with saving files in different formats and different locations. map different attributes from gapminder to see what they look like. Show the result.
Connected book
Written for
- Institution
- Visual Analytics
- Course
- Visual Analytics
Document information
- Uploaded on
- April 16, 2023
- Number of pages
- 19
- Written in
- 2022/2023
- Type
- Exam (elaborations)
- Contains
- Questions & answers
Subjects
-
visualanalyticsweek4necsolved
Also available in package deal