Started on Saturday, 15 April 2023, 12:16 AM
State Finished
Completed on Saturday, 15 April 2023, 1:08 AM
Time taken 52 mins 4 secs
Marks 15.47/20.00
Grade 77.33 out of 100.00
Question 1
Complete
Mark 1.00 out of 1.00
Flag question
Question text
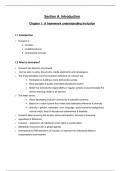
Study the accompanying map showing the world distribution of alcohol consumption
per capita in 2006. Based on this map, which of the following observations
is/are correct?
Select one or more:
a.
Australia, Russia and Nigeria all three have an alcohol consumption per capita in the
same range.
b.
The alcohol consumption per capita of Peru is between 6.3 and 9.
c.
The alcohol consumption per capita of India and Libya is in the same range.
d.
North American countries generally have a higher alcohol consumption per capita than
North African countries.
e.
China has a higher alcohol consumption per capita than Namibia.
Question 2
Complete
Mark 1.00 out of 1.00
, Flag question
Question text
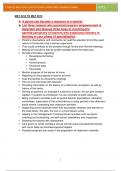
Study the accompanying map showing the world distribution of alcohol consumption
per capita in 2006. Based on this map, which of the following observations
is/are correct?
Select one or more:
a.
The alcohol consumption per capita of Brazil is between 6.3 and 9.
b.
Australia, Russia and Uganda all three have an alcohol consumption per capita in the
same range.
c.
Russia has a higher alcohol consumption per capita than India.
d.
West European countries generally have a higher alcohol consumption per capita than
North American countries.
e.
The alcohol consumption per capita of Saudi Arabia is between 1 and 3.7.
Question 3
Complete
Mark 1.00 out of 1.00
Flag question
Question text
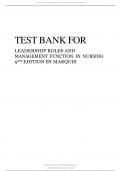
Study the accompanying two maps showing deaths among children under five years of
age due to diarrhoeal diseases (2000) and access to safe drinking water (2000). Which of
the following observations about these two maps is/are correct?
State Finished
Completed on Saturday, 15 April 2023, 1:08 AM
Time taken 52 mins 4 secs
Marks 15.47/20.00
Grade 77.33 out of 100.00
Question 1
Complete
Mark 1.00 out of 1.00
Flag question
Question text
Study the accompanying map showing the world distribution of alcohol consumption
per capita in 2006. Based on this map, which of the following observations
is/are correct?
Select one or more:
a.
Australia, Russia and Nigeria all three have an alcohol consumption per capita in the
same range.
b.
The alcohol consumption per capita of Peru is between 6.3 and 9.
c.
The alcohol consumption per capita of India and Libya is in the same range.
d.
North American countries generally have a higher alcohol consumption per capita than
North African countries.
e.
China has a higher alcohol consumption per capita than Namibia.
Question 2
Complete
Mark 1.00 out of 1.00
, Flag question
Question text
Study the accompanying map showing the world distribution of alcohol consumption
per capita in 2006. Based on this map, which of the following observations
is/are correct?
Select one or more:
a.
The alcohol consumption per capita of Brazil is between 6.3 and 9.
b.
Australia, Russia and Uganda all three have an alcohol consumption per capita in the
same range.
c.
Russia has a higher alcohol consumption per capita than India.
d.
West European countries generally have a higher alcohol consumption per capita than
North American countries.
e.
The alcohol consumption per capita of Saudi Arabia is between 1 and 3.7.
Question 3
Complete
Mark 1.00 out of 1.00
Flag question
Question text
Study the accompanying two maps showing deaths among children under five years of
age due to diarrhoeal diseases (2000) and access to safe drinking water (2000). Which of
the following observations about these two maps is/are correct?