STATISTICS INFORMED
DECISIONS USING DATA 5TH
EDITION SULLIVAN TEST BANK
,Statistics Informed Decisions Using Data 5th Edition Sullivan Test Bank
Ch. 2 Organizing and Summarizing Data
2.1 Organizing Qualitative Data
1 Organize qualitative data in tables.
SHORT ANSWER. Write the word or phrase that best completes each statement or answers the question.
Provide an appropriate response. Round relative frequencies to thousandths.
1) Scott Tarnowski owns a pet grooming shop. His prices for grooming dogs are based on the size of the dog.
His records from last year are summarized below. Construct a frequency distribution and a relative
frequency distribution. Show the percentage represented by each relative frequency.
Class Frequency
Large 345
Medium 830
Small 645
2) The results of a survey about a recent judicial appointment are given in the table below. Construct a relative
frequency distribution.
Response Frequency
Strongly Favor 7
Favor 8
Neutral 18
Oppose 38
Strongly 129
Oppose
3) The preschool children at Elmwood Elementary School were asked to name their favorite color. The results
are listed below. Construct a frequency distribution and a relative frequency distribution.
purple purple green red blue
blue blue purple blue green
blue green red red red
green blue red blue yellow
MULTIPLE CHOICE. Choose the one alternative that best completes the statement or answers the question.
4) True or False: The sum of all the relative frequencies of a distribution will always add up to 1.
A) False B) True
5) True or False: Relative frequency is the proportion (or percent) of observations within a category and is
found
using the formula: relative frequency = sum of
all frequencies. frequency
A) False B) True
Page 1
,Page 1
2 Construct bar graphs.
MULTIPLE CHOICE. Choose the one alternative that best completes the statement or answers the question.
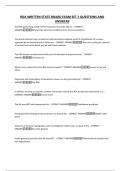
The bar graph shows the number of tickets sold each week by the garden club for their annual flower show.
6) During which week was the most number of tickets sold?
A) week 4 B) week 5 C) week 2 D) week 1
7) During which week was the fewest number of tickets sold?
A) week 2 B) week 4 C) week 6 D) week 5
8) Approximately how many tickets were sold during week 2?
A) 11 tickets B) 30 tickets C) 59 tickets D) 40 tickets
Provide an appropriate response.
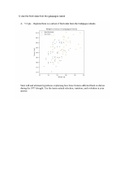
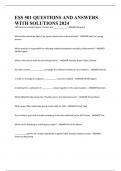
9) The payroll amounts for 26 major-league baseball teams are shown below. Aprroximately what percentage of
the payrolls were in the $20-$30 million range? Round to the nearest whole percent.
A) 38% B) 10% C) 59% D) 11%
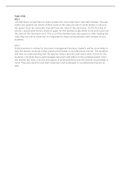
10) Retailers are always interested in determining why a customer selected their store to make a purchase. A
sporting goods retailer conducted a customer survey to determine why its customers shopped at the store.
Page 2
, The results are shown below. What percentage of the customers responded that the merchandise was the
reason they shopped at the store? Round to the nearest whole percent
A) 43% B) 30% C) 50% D) 29%
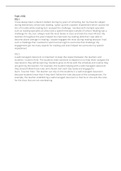
11) The bar graph below shows the political party affiliation of 1000 registered U.S. voters. What percentage of
the 1000 registered U.S. voters belonged to one of the traditional two parties (Democratic and Republican)?
A) 75% B) 40% C) 35% D) 25%
12) The Excel frequency bar graph below describes the employment status of a random sample of U.S. adults.
What is the percentage of those having no job?
A) 15% B) 20% C) 40% D) cannot determine
Page 3
DECISIONS USING DATA 5TH
EDITION SULLIVAN TEST BANK
,Statistics Informed Decisions Using Data 5th Edition Sullivan Test Bank
Ch. 2 Organizing and Summarizing Data
2.1 Organizing Qualitative Data
1 Organize qualitative data in tables.
SHORT ANSWER. Write the word or phrase that best completes each statement or answers the question.
Provide an appropriate response. Round relative frequencies to thousandths.
1) Scott Tarnowski owns a pet grooming shop. His prices for grooming dogs are based on the size of the dog.
His records from last year are summarized below. Construct a frequency distribution and a relative
frequency distribution. Show the percentage represented by each relative frequency.
Class Frequency
Large 345
Medium 830
Small 645
2) The results of a survey about a recent judicial appointment are given in the table below. Construct a relative
frequency distribution.
Response Frequency
Strongly Favor 7
Favor 8
Neutral 18
Oppose 38
Strongly 129
Oppose
3) The preschool children at Elmwood Elementary School were asked to name their favorite color. The results
are listed below. Construct a frequency distribution and a relative frequency distribution.
purple purple green red blue
blue blue purple blue green
blue green red red red
green blue red blue yellow
MULTIPLE CHOICE. Choose the one alternative that best completes the statement or answers the question.
4) True or False: The sum of all the relative frequencies of a distribution will always add up to 1.
A) False B) True
5) True or False: Relative frequency is the proportion (or percent) of observations within a category and is
found
using the formula: relative frequency = sum of
all frequencies. frequency
A) False B) True
Page 1
,Page 1
2 Construct bar graphs.
MULTIPLE CHOICE. Choose the one alternative that best completes the statement or answers the question.
The bar graph shows the number of tickets sold each week by the garden club for their annual flower show.
6) During which week was the most number of tickets sold?
A) week 4 B) week 5 C) week 2 D) week 1
7) During which week was the fewest number of tickets sold?
A) week 2 B) week 4 C) week 6 D) week 5
8) Approximately how many tickets were sold during week 2?
A) 11 tickets B) 30 tickets C) 59 tickets D) 40 tickets
Provide an appropriate response.
9) The payroll amounts for 26 major-league baseball teams are shown below. Aprroximately what percentage of
the payrolls were in the $20-$30 million range? Round to the nearest whole percent.
A) 38% B) 10% C) 59% D) 11%
10) Retailers are always interested in determining why a customer selected their store to make a purchase. A
sporting goods retailer conducted a customer survey to determine why its customers shopped at the store.
Page 2
, The results are shown below. What percentage of the customers responded that the merchandise was the
reason they shopped at the store? Round to the nearest whole percent
A) 43% B) 30% C) 50% D) 29%
11) The bar graph below shows the political party affiliation of 1000 registered U.S. voters. What percentage of
the 1000 registered U.S. voters belonged to one of the traditional two parties (Democratic and Republican)?
A) 75% B) 40% C) 35% D) 25%
12) The Excel frequency bar graph below describes the employment status of a random sample of U.S. adults.
What is the percentage of those having no job?
A) 15% B) 20% C) 40% D) cannot determine
Page 3