H_R_Diagram_Gizmo_Lab.pdf.docx9
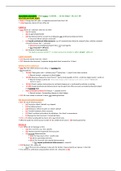
Gizmo Warm-up In the early 1900s, astronomers identified many star characteristics such as color, size, temperature, and luminosity—or how bright a star is. Using the H-R Diagram Gizmo, you will discover how some of these characteristics are related. Start by moving your cursor over the stars in the Star collection. Star information is displayed on the right side of the Gizmo. The numbers given for Luminosity, Radius, and Mass are in comparison to the Sun. So, a star with a radius of “2 Suns” is twice as large as the Sun. Temperature is given using the Kelvin scale, where 273.15 K = 0 °C and 373.15 K = 100 °C. 1. Find Betelgeuse in the Star collection. Fill out the chart at right. 2. The Sun has a radius of 695,500 km. What is the radius of Betelgeuse? Betelgeuse has a radius of 1000 km. Activity A: Color and temperature Get the Gizmo ready: • Make sure Arrange stars is selected and Color is selected on the Arranged by menu. Question: How is the color of a star related to its temperature? 1. Predict: If you look closely at some stars in the night sky, you can see slight differences in their color. Some stars look reddish. Others appear orange, white, or blue. What do you think the color of a star indicates about its temperature? The color of a star indicates the stars wavelength. The wavelength determines the stars temperature. The hotter the star, the more blue it is. The cooler the star, the more orange it is. 2. Organize: Compare the colors of the following stars in the Star collection: Aldebaran, Betelgeuse, Sirius B, Spica, the Sun, and Vega. Drag the six stars to position them where you think they would fit on the Gizmo’s color scale. Click Sort stars on the Gizmo to check your placements. 3. Organize: On the Arranged by menu, select Temperature. Based on their given temperatures, plot the stars on the Gizmo scale. When you are finished, click Sort stars to check your placements. Revise your chart if necessary. Activity A (continued from previous page) 4. Analyze: What relationship, if any, do you see between a star’s color and its temperature? The more orange the star is, the cooler the star is. The more blue the star is, the hotter the star is. 5. Graph: You will now create a graph to confirm any relationships you found between a star’s color and temperature. Select Graphical plot. Using the dropdown menus at the top of the screen, select Color vs. Temperature. Position the six stars on the graphical plot. A. What pattern do you see in the graph? The stars that are more orange are towards the bottom left of the graph. The stars that are more blue are towards the top right of the graph. B. What does the graph show about the relationship of a star’s color and temperature? Explain. The cooler the star, the more orange it is. The hotter the star, the more blue it is. C. Click Move all and then Sort stars. Is the relationship still evident? Yes 6. Infer: Naos is a star in the Argos constellation. It has a very deep blue color. What do you think is the approximate temperature of Naos? 30,000 K 7. Apply: The flame of many stove burners is blue, but the wires of a toaster glow orange. How do you think the temperatures of these two cooking appliances compare? The flame of the stove burners is blue because the fire is very hot. The wires of a toaster are orange because the toaster is hot, but not as hot as the stove. Activity B: Luminosity, mass, and radius Get the Gizmo ready: • Click Reset. Select Arrange stars. • Select Luminosity on the Arranged by menu. Question: How are a star’s luminosity, mass, and radius related? 1. Organize: Position Aldebaran, Betelgeuse, Sirius B, Spica, the Sun, and Vega on the Gizmo’s luminosity scale(Remember to click Sort stars to check your placements.) 2. Organize: Select Radius from the Arranged by menu. Position the stars on the Gizmo’s radius scale (Remember to click Sort stars to check your placements.) 3. Organize: Select Mass from the Arranged by menu. Position the stars on the Gizmo’s mass scale(Remember to click Sort stars to check your placements.) 4. Compare: Study the scales you’ve made. A. How do the stars’ luminosity compare with their radii? The more luminous the star, the bigger the radii. B. How do the stars’ radii compare with their mass? The bigger the radii, the higher the mass. (Activity B continued on next page) Activity B (continued from previous page) 5. Predict: Consider any relationships you see between a star’s luminosity, radius, and mass. A. As the radius of a star increases, how do you think its luminosity might change? As the radius of a star increases, I predict the luminosity will increase. B. As the mass of a star increases, how do you think its luminosity might change? As the mass of a star increases, I predict the luminosity will increase. C. As the radius of a star increases, how do you think its mass might change? As the radius of the star increases, I predict the mass will increase. 6. Graph: Select Graphical plot. Using the dropdown menus, select Luminosity vs. Radius, and click Move all and then Sort stars. Describe any relationships you see. The blue colored stars are gathered in the middle of the graph. The stars that are more luminous, have a bigger radius. The stars that are less luminous, have a smaller radius. 7. Explain: Why would the size of a star affect its luminosity? Bigger stars have more “room” to give off more light, therefore as a star increases in size, the luminosity also increases. 8. Compare: Select Luminosity vs. Mass, and click Sort stars. How does this graph compare with the Luminosity vs. Radius graph? The Luminosity vs. Mass graph is similar to the Luminosity vs. Radius graph. One difference I notice is in this graph, the blue stars are a little more spread out, rather than all gathering in the middle of the graph. 9. Graph: Select Mass vs. Radius, and click Sort stars. Describe any relationships you see. The stars with the bigger radii, have the higher mass. The stars with the smaller radii, have a lower mass. 10. Interpret: Which star do you think is the densest: Antares, Spica, or Polaris? Explain. Spica is probably the densest out of the three stars given. This is because Spica has a high mass, but a low radius. Activity C: Luminosity and temperature Get the Gizmo ready: • Click Reset. • Select H-R diagram. Introduction: In the early 1900s, two astronomers—Ejnar Hertzsprung and Henry Norris Russell—independently made a graph comparing star luminosity and temperature. This graph, now known as a Hertzsprung-Russell diagram, or H-R diagram, is still used today to classify stars into groups. Question: What does an H-R diagram reveal about star types? 1. Observe: Look at the temperature axis on the diagram. What is unusual about this axis? The temperature axis has the highest temperature on the left of the graph and the lowest temperature on the right of the graph. The temperature scale goes backward because the original H-R diagram plotted luminosity vs. color, with the color ranging from blue to red. 2. Predict: How do you think the luminosity of a star is related to its temperature? I predict the more luminous the star, the hotter the star. 3. Classify: Click Move all and then Sort stars. Click the Tools palette at lower left and click Screen shot. Right click the image, click Copy Image, and paste a screenshot of the diagram in a blank document that you will turn in with this worksheet. Circle stars that you think belong in a group together. On the lines below, explain your groupings. I grouped them together based on which phase they are in. I circled the Supergiants in pink, the Main Sequence in orange and the White Dwarfs in yellow. Stars that are White Dwarfs are small and dense, stars that are on the Main Sequence appear from the top left to the bottom right of the H-R Diagram, and Supergiants are big and luminous stars. 4. Identify: Turn on Show star groups. A. Which group are most stars found in? Most stars are found on the Main Sequence. B. How would you characterize stars in this group? Stars on the Main Sequence are going through nuclear fusion which turns Hydrogen into Helium, 90% of stars spend life on the Main Sequence and the mass of the star determines its location on the Main Sequence. (Activity C continued on next page) Activity C (continued from previous page) 5. Describe: More than 90 percent of all stars in the universe, including the Sun, are main sequence stars. As main sequence stars age, they move up and to the right on the H-R diagram and become giants or supergiants. What are the characteristics of giants and supergiants? Giants and Supergiants are coldeer, are very luminous, and have a large radius. Main sequence stars produce heat by fusing hydrogen atoms into helium in their core. Giants and supergiants form when the star’s core runs out of hydrogen and begins to collapse due to the force of gravity. As this occurs, hydrogen-rich outer layers of the star heat up enough to start forming helium, causing the star to rapidly expand. 6. Compare: Study the H-R diagram. A. Which stars are white dwarfs? Sirius B and Procyon B B. What are the characteristics of white dwarfs? White Dwarfs have a smaller mass, aren’t very luminous, and are hotter. White dwarfs are small, hot stars that are near the end of their lives. They are the leftover cores of giants and supergiants. 7. Classify: Proxima Centauri is the nearest star to the Sun. It has a luminosity of 0.0017 and a temperature of 3,000 K. A. Which star group does Proxima Centauri belong to? Main Sequence B. On the H-R diagram, which star would Proxima Centauri be near? Barnard’s Star
Written for
- Institution
- H-R
- Course
- H-R
Document information
- Uploaded on
- April 5, 2023
- Number of pages
- 8
- Written in
- 2022/2023
- Type
- Exam (elaborations)
- Contains
- Questions & answers