Interpretation of financial statements
Interpreting financial statements is important as it allows decision making. For example, how
much would a bank be prepared to lend a company.
Trend analysis which is horizontal analysis is calculating the change in line items over a
period of time and comparing the different years. To compare, the start year is used as a
base figure of 100%. This makes it easier to see the growth in sales.
Trend analysis which is vertical analysis concentrates on one year’s financial statements. And
all items in the financial statements are a percentage of one figure e.g sales in the SPL and
total assets in the SFP. This allows comparisons of companies that are different sizes so it is
therefore called size analysis.
Horizontal and vertical analysis is usually combined to interpret the financial statements
better.
Financial ratios describe the relationship between different items in the financial
statements. They are used to assess and improve the company’s performance. Financial
ratios need to be compared against proceeding period ratios, budgeted ratios for the current
period, ratios of other companies and industry sector averages. The ratios will show good or
bad areas of performance and areas of significant change.
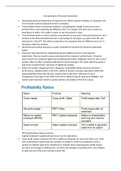
Ratios are usually categorised into 5 categories: profitability which measures the firm’s
performance, liquidity which is the firm’s ability to finance everyday operations whilst still
paying liabilities when they fall due, activity which is the firm’s efficiency in asset
management, leverage or risk which is the firm’s ability to pay its long-term liabilities, and
market and investment which is capital markets’ perception of the firm’s share.
PBIT=profit before interest and tax
Capital employed= capital business has to run the operations
Gross profit margin measures the firm’s ability to sell goods for more than their cost. If the
ratio is declining it could mean the company is unable to control its production costs or
achieve an optimal sales price. Questions to consider when analysing gross profit margin-
are there any changes in selling price, are there any changes in purchase price, any changes
in sales mix and if there are inventory write offs.
Interpreting financial statements is important as it allows decision making. For example, how
much would a bank be prepared to lend a company.
Trend analysis which is horizontal analysis is calculating the change in line items over a
period of time and comparing the different years. To compare, the start year is used as a
base figure of 100%. This makes it easier to see the growth in sales.
Trend analysis which is vertical analysis concentrates on one year’s financial statements. And
all items in the financial statements are a percentage of one figure e.g sales in the SPL and
total assets in the SFP. This allows comparisons of companies that are different sizes so it is
therefore called size analysis.
Horizontal and vertical analysis is usually combined to interpret the financial statements
better.
Financial ratios describe the relationship between different items in the financial
statements. They are used to assess and improve the company’s performance. Financial
ratios need to be compared against proceeding period ratios, budgeted ratios for the current
period, ratios of other companies and industry sector averages. The ratios will show good or
bad areas of performance and areas of significant change.
Ratios are usually categorised into 5 categories: profitability which measures the firm’s
performance, liquidity which is the firm’s ability to finance everyday operations whilst still
paying liabilities when they fall due, activity which is the firm’s efficiency in asset
management, leverage or risk which is the firm’s ability to pay its long-term liabilities, and
market and investment which is capital markets’ perception of the firm’s share.
PBIT=profit before interest and tax
Capital employed= capital business has to run the operations
Gross profit margin measures the firm’s ability to sell goods for more than their cost. If the
ratio is declining it could mean the company is unable to control its production costs or
achieve an optimal sales price. Questions to consider when analysing gross profit margin-
are there any changes in selling price, are there any changes in purchase price, any changes
in sales mix and if there are inventory write offs.