Stats 244
Chapter 1: Simple regression
Aim
- To see if there is a linear relationship between a dependant variable (Y) and an
independent variable (X)
- If there is a relationship, we aim to predict Y for a given X
Model: Y = 0 + 1X
Procedure
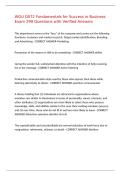
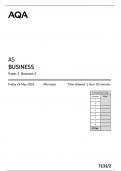
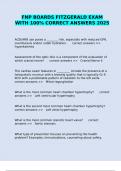
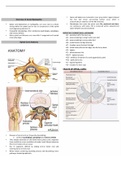
Scatter diagram
- Plot a scatter diagram of the data (Ensure Y variable is on Y-axis)
- Add a trend line to the data to see if a relationship exists
- Shows that there is a negative relationship between the two
Correlation analysis
- If there is a relationship, we want to know how strong the relationship is
- This is done by calculation the correlation
𝑐𝑜𝑣(𝑋, 𝑌)
𝑟=
𝑆𝑋 𝑆𝑌
- 𝑐𝑜𝑣(𝑋, 𝑌) = Covariance between X and Y
- 𝑆𝑋 = 𝜎𝑋 = Standard deviation of X
Chapter 1: Simple regression
Aim
- To see if there is a linear relationship between a dependant variable (Y) and an
independent variable (X)
- If there is a relationship, we aim to predict Y for a given X
Model: Y = 0 + 1X
Procedure
Scatter diagram
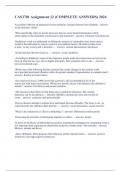
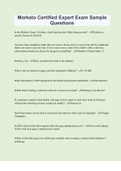
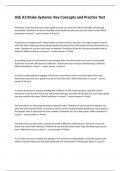
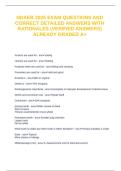
- Plot a scatter diagram of the data (Ensure Y variable is on Y-axis)
- Add a trend line to the data to see if a relationship exists
- Shows that there is a negative relationship between the two
Correlation analysis
- If there is a relationship, we want to know how strong the relationship is
- This is done by calculation the correlation
𝑐𝑜𝑣(𝑋, 𝑌)
𝑟=
𝑆𝑋 𝑆𝑌
- 𝑐𝑜𝑣(𝑋, 𝑌) = Covariance between X and Y
- 𝑆𝑋 = 𝜎𝑋 = Standard deviation of X