theonlinephysicstutor.com
Q1. (
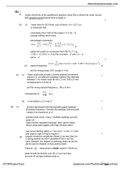
a) (mark should be at the equilibrium position) since this is where the mass moves
with greatest speed [transit time is least] ✔
1
(b) (i) mean time for 20T (from sum of times ÷5) = 22.7 (s) 1
✔ (minimum 3sf)
uncertainty (from half of the range) = 0.3 (s) 2 ✔
(accept trailing zeros here)
percentage uncertainty
✔
(allow full credit for conversion from 20T to T, e.g.
1.135 = 1 ✔ 0.015 = 2 ✔ ecf for incorrect 1 ✔ and / or 2 ✔
earns 3 ✔
3
(ii) natural frequency ✔
(ecf for wrong mean 20T; accept ≥ 4 sf)
(c) (i) linear scale with at least 3 evenly-spaced convenient 1
values (i.e. not difficult multiples) marked; the intervals
between 1 Hz marks must be 40 ± 2 mm (100 ± 5 mm
corresponds to 2.5 Hz) ✔
(ecf for wrong natural frequency: 100 ± 5 mm
corresponds to Hz)
(ii) 4 mm [allow ± 0.2 mm] ✔ 1
(d) (i) student decreased intervals [smaller gaps] between
1
[increase frequency / density of] readings (around peak
/ where A is maximum) ✔ ✔
[student took more / many / multiple readings (around
peak) ✔]
(reject bland ‘repeated readings’ idea; ignore ideas
about using data loggers with high sample rates)
new curve starting within ± 1 mm of A = 4 mm, f = 0 Hz
with peak to right of that in Figure 3 2
(ii) (expect maximum amplitude shown to be less than for
2 spring system but don’t penalise if this is not the
case; likewise, the degree of damping need not be the
same (can be sharper or less pronounced)
Peak at value given in (b)(ii); expect 1.25 Hz so
peak should be directly over 50 ± 5 mm but take
account of wrongly-marked scale ✔
2
@TOPhysicsTutor facebook.com/TheOnlinePhysicsTutor
[11]
, theonlinephysicstutor.com
Q2. (
a) Clear identification of distance from centre of sphere to right hand end of mark, or to
near r.h.end of mark ✓
1
(b) 0.393 (s) ✓
Accept 0.39 (s)
1
(c) For 10 oscillations percentage uncertainty = = 0.00637 ≡ 0.64% ✓
same for the ¼ period ✓
2
(d) Identifies anomaly [0.701] ✓ and calculates mean distance = 0.759 (m)✓
Allow 1 max if anomaly included in calculation giving 0.750
(m)
2
(e) Largest to smallest variation = 0.026 (m)
Absolute uncertainty = 0.013 (m)✓
1
(f) Use of g = leading to
9.83 (m s-2) ✓
Allow 9.98 (m s-2) if 0.39 used
Ecf if anomaly included in mean in (d)
percentage uncertainty in distance = 1.7%✓
Total percentage uncertainty =
1.7 + 2 x 0.64 = 3.0%
Absolute uncertainty = 0.30 (m s-2) ✓
[g = 10.0 ± 0.3 m s-2]
Expressed sf must be consistent with uncertainty 3
calculations
@TOPhysicsTutor facebook.com/TheOnlinePhysicsTutor
Q1. (
a) (mark should be at the equilibrium position) since this is where the mass moves
with greatest speed [transit time is least] ✔
1
(b) (i) mean time for 20T (from sum of times ÷5) = 22.7 (s) 1
✔ (minimum 3sf)
uncertainty (from half of the range) = 0.3 (s) 2 ✔
(accept trailing zeros here)
percentage uncertainty
✔
(allow full credit for conversion from 20T to T, e.g.
1.135 = 1 ✔ 0.015 = 2 ✔ ecf for incorrect 1 ✔ and / or 2 ✔
earns 3 ✔
3
(ii) natural frequency ✔
(ecf for wrong mean 20T; accept ≥ 4 sf)
(c) (i) linear scale with at least 3 evenly-spaced convenient 1
values (i.e. not difficult multiples) marked; the intervals
between 1 Hz marks must be 40 ± 2 mm (100 ± 5 mm
corresponds to 2.5 Hz) ✔
(ecf for wrong natural frequency: 100 ± 5 mm
corresponds to Hz)
(ii) 4 mm [allow ± 0.2 mm] ✔ 1
(d) (i) student decreased intervals [smaller gaps] between
1
[increase frequency / density of] readings (around peak
/ where A is maximum) ✔ ✔
[student took more / many / multiple readings (around
peak) ✔]
(reject bland ‘repeated readings’ idea; ignore ideas
about using data loggers with high sample rates)
new curve starting within ± 1 mm of A = 4 mm, f = 0 Hz
with peak to right of that in Figure 3 2
(ii) (expect maximum amplitude shown to be less than for
2 spring system but don’t penalise if this is not the
case; likewise, the degree of damping need not be the
same (can be sharper or less pronounced)
Peak at value given in (b)(ii); expect 1.25 Hz so
peak should be directly over 50 ± 5 mm but take
account of wrongly-marked scale ✔
2
@TOPhysicsTutor facebook.com/TheOnlinePhysicsTutor
[11]
, theonlinephysicstutor.com
Q2. (
a) Clear identification of distance from centre of sphere to right hand end of mark, or to
near r.h.end of mark ✓
1
(b) 0.393 (s) ✓
Accept 0.39 (s)
1
(c) For 10 oscillations percentage uncertainty = = 0.00637 ≡ 0.64% ✓
same for the ¼ period ✓
2
(d) Identifies anomaly [0.701] ✓ and calculates mean distance = 0.759 (m)✓
Allow 1 max if anomaly included in calculation giving 0.750
(m)
2
(e) Largest to smallest variation = 0.026 (m)
Absolute uncertainty = 0.013 (m)✓
1
(f) Use of g = leading to
9.83 (m s-2) ✓
Allow 9.98 (m s-2) if 0.39 used
Ecf if anomaly included in mean in (d)
percentage uncertainty in distance = 1.7%✓
Total percentage uncertainty =
1.7 + 2 x 0.64 = 3.0%
Absolute uncertainty = 0.30 (m s-2) ✓
[g = 10.0 ± 0.3 m s-2]
Expressed sf must be consistent with uncertainty 3
calculations
@TOPhysicsTutor facebook.com/TheOnlinePhysicsTutor