theonlinephysicstutor.com
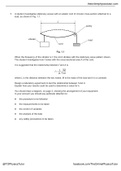
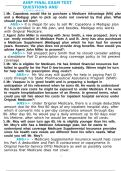
1 A student investigates stationary waves with an elastic cord of circular cross-section attached to a
load, as shown in Fig. 1.1.
L
pulley
vibrator load
cord
Fig. 1.1
When the frequency of the vibrator is f, the cord vibrates with the stationary wave pattern shown.
The student investigates how f varies with the cross-sectional area A of the cord.
It is suggested that the relationship between f and A is
1 M
f=
2L kA
where L is the distance between the two nodes, M is the mass of the load and k is a constant.
Design a laboratory experiment to test the relationship between f and A.
Explain how your results could be used to determine a value for k.
You should draw a diagram, on page 3, showing the arrangement of your equipment.
In your account you should pay particular attention to:
● the procedure to be followed
● the measurements to be taken
● the control of variables
● the analysis of the data
● any safety precautions to be taken.
@TOPhysicsTutor facebook.com/TheOnlinePhysicsTutor
, theonlinephysicstutor.com
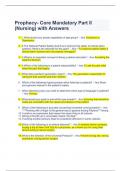
2 A student is investigating stationary waves on a stretched elastic cord. A vibrator attached to the
cord is connected to a signal generator.
The apparatus is set up as shown in Fig. 2.1.
pulley elastic cord
vibrator
M
Fig. 2.1
The mass M attached to the cord is adjusted until resonance is obtained. The number n of
antinodes on the stationary wave is recorded.
The experiment is repeated with different masses to obtain different values of n.
It is suggested that M and n are related by the equation
n Mg
f=
2L n
where f is the frequency of the vibrator, g is the acceleration of free fall, L is the length of the
elastic cord and n is the mass per unit length of the elastic cord.
1
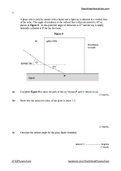
(a) A graph is plotted of M on the y-axis against on the x-axis.
n2
Determine an expression for the gradient.
gradient = .......................................................... [1]
@TOPhysicsTutor facebook.com/TheOnlinePhysicsTutor
1 A student investigates stationary waves with an elastic cord of circular cross-section attached to a
load, as shown in Fig. 1.1.
L
pulley
vibrator load
cord
Fig. 1.1
When the frequency of the vibrator is f, the cord vibrates with the stationary wave pattern shown.
The student investigates how f varies with the cross-sectional area A of the cord.
It is suggested that the relationship between f and A is
1 M
f=
2L kA
where L is the distance between the two nodes, M is the mass of the load and k is a constant.
Design a laboratory experiment to test the relationship between f and A.
Explain how your results could be used to determine a value for k.
You should draw a diagram, on page 3, showing the arrangement of your equipment.
In your account you should pay particular attention to:
● the procedure to be followed
● the measurements to be taken
● the control of variables
● the analysis of the data
● any safety precautions to be taken.
@TOPhysicsTutor facebook.com/TheOnlinePhysicsTutor
, theonlinephysicstutor.com
2 A student is investigating stationary waves on a stretched elastic cord. A vibrator attached to the
cord is connected to a signal generator.
The apparatus is set up as shown in Fig. 2.1.
pulley elastic cord
vibrator
M
Fig. 2.1
The mass M attached to the cord is adjusted until resonance is obtained. The number n of
antinodes on the stationary wave is recorded.
The experiment is repeated with different masses to obtain different values of n.
It is suggested that M and n are related by the equation
n Mg
f=
2L n
where f is the frequency of the vibrator, g is the acceleration of free fall, L is the length of the
elastic cord and n is the mass per unit length of the elastic cord.
1
(a) A graph is plotted of M on the y-axis against on the x-axis.
n2
Determine an expression for the gradient.
gradient = .......................................................... [1]
@TOPhysicsTutor facebook.com/TheOnlinePhysicsTutor