Scatter Plots, Association and Correlation
probability
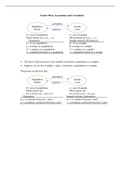
Population Sample
N=size statistics n=size
N = size of population n = size of sample
Observations are 𝑥1, 𝑥2, … , 𝑥𝑁 Observations are 𝑥1, 𝑥2, … , 𝑥𝑛
Parameters Sample statistics (Estimators)
p = % in a population 𝑝̂ = % in a sample
𝜇 = average in a population 𝑋̅= average in a sample
𝜎2 = variance in a population 𝑠2 = variance in a sample
𝜎 = standard deviation in a population s = standard deviation in a sample
• The above discussion uses one variable to describe a population or a sample.
• Suppose we use two variables x and y to describe a population or a sample
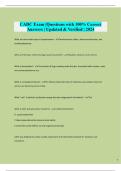
The picture would look like:
probability
Population Sample
N=size statistics n=size
N = size of population n = size of sample
Observations are Observations are
(𝑥1, 𝑦1), (𝑥2, 𝑦2), … , (𝑥𝑁, 𝑦𝑁) (𝑥1, 𝑦1), (𝑥2, 𝑦2), … , (𝑥𝑛, 𝑦𝑛)
Parameters Sample statistics (Estimators)
𝜎𝑥𝑦 = covariance between x and y 𝑠𝑥𝑦 = covariance between x and y
𝜌 = correlation coefficient between x and y r = correlation coefficient between x and y
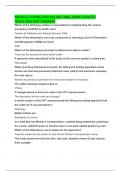
, 1. Scatterplots
Example 1. The scatterplot is performed using Excel.
x y
28 12.4 y
14
28 11.7
12
32.5 12.4
10
39 10.3
8
45.9 9.4
6
57.8 9.5
4
58.1 8
2
62.5 7.5
0
x
0 10 20 30 40 50 60 70
Example: Interest Rates and Inflation
• At the heart of Canada’s monetary policy framework is the inflation-control target, which
is two percent, the midpoint of a 1 to 3 percent target range.
o The inflation target is expressed as the year-over-year increase in the total
consumer price index (CPI). The Bank also monitors a set of “core” inflation
measures.
o To achieve the inflation target, the Bank adjusts (raises or lowers) its key policy rate
– the target for the overnight rate.
o Monetary policy actions take time – usually between six and eight quarters – to
work their way through the economy and have their full effect on inflation.
https://www.bankofcanada.ca/core-functions/monetary-policy/#inflation and https://www.bankofcanada.ca/core-
functions/monetary-policy/inflation/
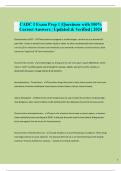
probability
Population Sample
N=size statistics n=size
N = size of population n = size of sample
Observations are 𝑥1, 𝑥2, … , 𝑥𝑁 Observations are 𝑥1, 𝑥2, … , 𝑥𝑛
Parameters Sample statistics (Estimators)
p = % in a population 𝑝̂ = % in a sample
𝜇 = average in a population 𝑋̅= average in a sample
𝜎2 = variance in a population 𝑠2 = variance in a sample
𝜎 = standard deviation in a population s = standard deviation in a sample
• The above discussion uses one variable to describe a population or a sample.
• Suppose we use two variables x and y to describe a population or a sample
The picture would look like:
probability
Population Sample
N=size statistics n=size
N = size of population n = size of sample
Observations are Observations are
(𝑥1, 𝑦1), (𝑥2, 𝑦2), … , (𝑥𝑁, 𝑦𝑁) (𝑥1, 𝑦1), (𝑥2, 𝑦2), … , (𝑥𝑛, 𝑦𝑛)
Parameters Sample statistics (Estimators)
𝜎𝑥𝑦 = covariance between x and y 𝑠𝑥𝑦 = covariance between x and y
𝜌 = correlation coefficient between x and y r = correlation coefficient between x and y
, 1. Scatterplots
Example 1. The scatterplot is performed using Excel.
x y
28 12.4 y
14
28 11.7
12
32.5 12.4
10
39 10.3
8
45.9 9.4
6
57.8 9.5
4
58.1 8
2
62.5 7.5
0
x
0 10 20 30 40 50 60 70
Example: Interest Rates and Inflation
• At the heart of Canada’s monetary policy framework is the inflation-control target, which
is two percent, the midpoint of a 1 to 3 percent target range.
o The inflation target is expressed as the year-over-year increase in the total
consumer price index (CPI). The Bank also monitors a set of “core” inflation
measures.
o To achieve the inflation target, the Bank adjusts (raises or lowers) its key policy rate
– the target for the overnight rate.
o Monetary policy actions take time – usually between six and eight quarters – to
work their way through the economy and have their full effect on inflation.
https://www.bankofcanada.ca/core-functions/monetary-policy/#inflation and https://www.bankofcanada.ca/core-
functions/monetary-policy/inflation/