Descriptive Statistics – Numerical Measures
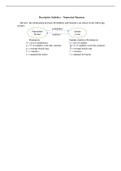
Review: the relationship between Probability and Statistics are shown in the following
picture:
probability
Population Sample
N=size statistics n=size
Parameters Sample statistics (Estimators)
N = size of population n = size of sample
p = % of students work this summer 𝑝̂ = % of students work this summer
𝜇 = average hourly pay 𝑋̅= average hourly pay
𝜎 2 = variance 𝑠 2 = variance
𝜎 = standard deviation s = standard deviation
, We discussed graphical methods to describe the population or the sample, and now we start
with the numerical description of the population and sample.
1. Measures of Central tendency
(a) Average (Mean)
• Population Mean 𝜇
Let 𝑥1, 𝑥2, … , 𝑥𝑁 be observations on the whole population of size N. The average (mean) is
denoted by 𝜇, and defined by 𝜇
• Sample Mean 𝑋̅
Let 𝑥1, 𝑥2, … , 𝑥𝑛 be observations on the sample of size n. The average (mean) is denoted
∑𝑥
by 𝑋̅, and defined by 𝑋̅ = 𝑖
𝑛
Construct a good prediction of the mean age of all of U of T’s alumni. Is this value 𝑋̅ or 𝜇? Answer with a
quantitative analysis & specify 𝑋̅ or 𝜇.
Solutions:
We must use the last column because the question asks about all U of T alumni (i.e. it asks about the
population).
These are grouped data. Picking the mid-point age for each group (a reasonable approximation) and
80 for the oldest group (this is the hardest to pick: any reasonable estimate of a typical age for the 70+ group
is acceptable).
𝜇 ≈ 0.142 ∗ 24.5 + 0.203 ∗ 34.5 + 0.177 ∗ 44.5 + 0.167 ∗ 54.5 + 0.147 ∗ 64.5 + 0.161 ∗ 80 = 49.8 Hence, the
mean age of all U of T alumni is about 50 years old: this is 𝜇, which is a population parameter.