Data Analysis
Lecture 1a
What do we want with this course?
Main course goals
- Automatization of SPSS skills
- Developing investigative attitude in data analysis
o Do not stick with 1 analysis
o Extract more from the data
o Ask questions about the outcomes
o Investigate these questions with new analysis
o Conduct multiple analysis with various perspectives
- Increasing of learning ability in data analysis
o Able to learn new analyses
o Seek information
o Solve problems
Lecture 1B
Data preparation
Relation of preparation to analysis
Preparation -> SPSS data -> analysis -> output
1. Conversion
2. Merging
3. Aggregate
4. Restructure
Conversion (Open, filetype)
Think for example about an excel file you want to convert to a SPSS file. In
SPSS you click on ‘open’ and chose a filetype. With text data it can be a bit
more complicated, try to avoid copy & paste. Text file can be delimited,
this means that values are separated by a comma, a semicolon, or a tab.
Problem with this is that in different computer systems a comma may be
seen as a comma or a decimal. So, a computer may read it as one number. The other
possibility is a fixed format, then it is determined in advance in which columns a value is. You
will tell which columns should be grouped together to get a number.
Merge
Different files are combined into one. Can be done in a file with the same
variables but with different cases. So, two files but the variables are the
same, you can merge them by adding cases. Another possibility is that you
add a file for the same subjects but with different variables, then you have
to add variables
- Add cases
o The files should have identical variable names (e.g., in one file the variable is
called age and, in another years, SPSS can’t identify this as the same variables)
, - Add variables
o The file should have identical cases but different variable names
o Id-variable required (key variable)
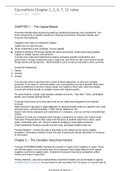
- Merge add variables
o One variable in a file should be merged to many in
another file
o SPSS: data menu -> merge files -> add variables ->
you can choose a file and chose a merge valid ->
sort files by values
o Key variable
Variable that identifies cases that should
be merged (e.g., user id, student number)
Must have same type and format in both files
1 is not 1 -> string 1 (characters) versus numeric 1
1 is not 1 -> 2 spaces versus 1 space
1 is not 1 -> string with 8 characters versus string with 9
Must be unique
Nothing is nothing, there is a missing value in the original table
-> Missing = missing, either missing values could be merged to
the missing one
Must be sorted
Closed can be open -> file contention
problem
- What should be done if the files do not contain the same
cases? So, some of the data is missing or one has more
cases etc.
Aggregate
SPSS micro data -> SPSS aggregated data. Suppose you would only need the
group means instead of all the individual values. SPSS: data -> aggregate -> can
be added to the current data set or make a new data set. With the new file you
can do further analysis. If you add it to the current set, the mean is added to all
individual cases in a certain group
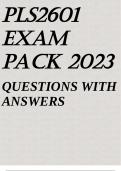
Restructure
You can present data in different ways. Long = written below each other,
wide = each subject is only one row SPSS data long -> SPSS data wide =
cases into variables. SPSS data wide -> SPSS data long = variables into
cases.
- Cases into variables identifier = subject, index = a condition, what
changes with restructuring is where you place the identifiers and
the indexes. Less cases, more variables
- Variables into cases
College 2A: soorten analyses; onderzoeken van assumpties
Soorten analyses in een onderzoek
- Vooraf
, o Power analyses, doe je vooraf om te weten hoe groot je steekproef moet zijn
o Conversie, koppeling, aggregatie
o Cleaning en controle
- Inleidend
o Validering (factor analyse, betrouwbaarheid)
o Berekening afgeleide maten (somscores, transformaties)
o Manipulatie checks
o Beschrijvende analyses (verschil gemiddelden)
- Hoofdanalyses
o Verklarende analyses (uitpartialiseren storende variabelen, geslacht heeft
misschien effect maar als je ook studiekeuze erbij pakt dan niet meer, kan
doordat er meer meisjes bij psychologie zitten)
o Bevestigende analyses (andere analyses voor zelfde vraag, andere soort toets)
o Synthetiserende analyses (tegenstrijdigheden verklaren)
o Assumpties controleren (moet je mee oppassen)
- Vervolganalyses
o Tracerende analyses (mediërende variabelen, analyse uitbreiden)
o Invariantie analyses (subgroepen onderverdelen)
o Post hoc toetsen
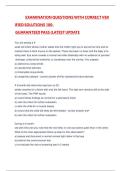
Voorbeeld statistiek 2Ba
Welke analyses kun je hiermee doen? Specificeer dit ook echt, naam van de
analyse, AV, WS, BS, CO en indeling van metingen waar nodig. Voorbeelden uit zaal:
- T-toets onafhankelijke steekproef, als AV
verschilscores, BS geslacht
- GLM repeated measures, WS voor en na, AV
correct aantal antwoorden, BS factor geslacht
(indeling meting WS: correct1 en correct2)
- T-toets voor gekoppelde paren met Correct1 en
Correct2
- Gemiddelden berekenen
- ANCOVA, geslacht als BS, Correct1 als CO en
Correct2 als AV
Deze analyses zijn niet allemaal verschillend, de t-toetsen
en gemiddelden kunnen ook gevonden worden via de
GLM, de ANCOVA is dan wel weer echt een andere
analyse. Analyses bevatten elkaar, aanleiding hiervoor kan je zien door zelfde p-waarde
Hoe onderzoek je assumpties
- Helemaal niet?
o Meest gebruikelijk in psychologie
- Toetsing?
o Nee! Geeft een soort nepzekerheid maar wordt op internet helaas soms
geadviseerd
- Visuele inspectie
o Is een optie, maar met welke vuistregels werk je en waar ligt de grens?
- Vuistregel
, o Moet gepubliceerd zijn
- Kan op meerdere manieren
o Van makkelijk tot moeilijk, van oppervlakkig tot grondig
- Exploratief?
o Exploratieve analyses moet je altijd doen, maar
o Assumpties kun je pas onderzoeken als de hoofdanalyse bekend is
- Analyse doen waarbij de assumpties niet aanwezig zijn
o Stel je weet niet of iets normaal verdeeld is, dan pak je niet de t-toets maar
bijvoorbeeld non-parametrische toets
o Beste optie volgens Jules
Adviezen
Van beste naar slechtst maar ook van minst gedaan naar vaakst gedaan
- Doe een analyse die de assumptie niet nodig heeft
- Gebruik een peer-reviewed gepubliceerde vuistregel om de assumptie te
onderzoeken
- Toets de assumptie met een statistische toets
- Negeer de assumptie
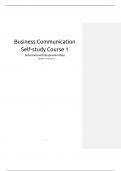
Waarom is het vaak verkeerd om assumpties te toetsen?
Voorbeeld t-toets onafhankelijke steekproeven:
Sommige boeken zeggen: doe eerst levene’s test,
beslis op grond daarvan of je de ene of de andere t-
toets gebruikt. Lijkt logisch, maar is fout je kunt beter
direct de tweede gebruiken. F toets kan nooit met
zekerheid bepalen of de varianties gelijk zijn of die precies gelijk zijn is ook niet zo van belang
en F-toets toetst of ze éxact gelijk zijn en F toets is ook afhankelijk van scheefheid en t-toets
niet
- Assumptions of the t-test for independent samples:
o Independent simple draws, not multilevel
o Fixed sample size, set a priori
o Fixed decision rule: reject H0 if t > tcrit
o Normality
o Equal variances?
- Checking assumptions:
o Check normality and variances in sample
o Decide to use t-test or not
- Checking assumption creates a violation of assumptions
o It is not recommended in some undergraduate statistics books
o But not in peer reviewed
articles in statistical journals?
o E.g., recommended by Field,
based on SPSS help, based on
Hays (1973)
o But Hays recommends the
opposite
Lecture 1a
What do we want with this course?
Main course goals
- Automatization of SPSS skills
- Developing investigative attitude in data analysis
o Do not stick with 1 analysis
o Extract more from the data
o Ask questions about the outcomes
o Investigate these questions with new analysis
o Conduct multiple analysis with various perspectives
- Increasing of learning ability in data analysis
o Able to learn new analyses
o Seek information
o Solve problems
Lecture 1B
Data preparation
Relation of preparation to analysis
Preparation -> SPSS data -> analysis -> output
1. Conversion
2. Merging
3. Aggregate
4. Restructure
Conversion (Open, filetype)
Think for example about an excel file you want to convert to a SPSS file. In
SPSS you click on ‘open’ and chose a filetype. With text data it can be a bit
more complicated, try to avoid copy & paste. Text file can be delimited,
this means that values are separated by a comma, a semicolon, or a tab.
Problem with this is that in different computer systems a comma may be
seen as a comma or a decimal. So, a computer may read it as one number. The other
possibility is a fixed format, then it is determined in advance in which columns a value is. You
will tell which columns should be grouped together to get a number.
Merge
Different files are combined into one. Can be done in a file with the same
variables but with different cases. So, two files but the variables are the
same, you can merge them by adding cases. Another possibility is that you
add a file for the same subjects but with different variables, then you have
to add variables
- Add cases
o The files should have identical variable names (e.g., in one file the variable is
called age and, in another years, SPSS can’t identify this as the same variables)
, - Add variables
o The file should have identical cases but different variable names
o Id-variable required (key variable)
- Merge add variables
o One variable in a file should be merged to many in
another file
o SPSS: data menu -> merge files -> add variables ->
you can choose a file and chose a merge valid ->
sort files by values
o Key variable
Variable that identifies cases that should
be merged (e.g., user id, student number)
Must have same type and format in both files
1 is not 1 -> string 1 (characters) versus numeric 1
1 is not 1 -> 2 spaces versus 1 space
1 is not 1 -> string with 8 characters versus string with 9
Must be unique
Nothing is nothing, there is a missing value in the original table
-> Missing = missing, either missing values could be merged to
the missing one
Must be sorted
Closed can be open -> file contention
problem
- What should be done if the files do not contain the same
cases? So, some of the data is missing or one has more
cases etc.
Aggregate
SPSS micro data -> SPSS aggregated data. Suppose you would only need the
group means instead of all the individual values. SPSS: data -> aggregate -> can
be added to the current data set or make a new data set. With the new file you
can do further analysis. If you add it to the current set, the mean is added to all
individual cases in a certain group
Restructure
You can present data in different ways. Long = written below each other,
wide = each subject is only one row SPSS data long -> SPSS data wide =
cases into variables. SPSS data wide -> SPSS data long = variables into
cases.
- Cases into variables identifier = subject, index = a condition, what
changes with restructuring is where you place the identifiers and
the indexes. Less cases, more variables
- Variables into cases
College 2A: soorten analyses; onderzoeken van assumpties
Soorten analyses in een onderzoek
- Vooraf
, o Power analyses, doe je vooraf om te weten hoe groot je steekproef moet zijn
o Conversie, koppeling, aggregatie
o Cleaning en controle
- Inleidend
o Validering (factor analyse, betrouwbaarheid)
o Berekening afgeleide maten (somscores, transformaties)
o Manipulatie checks
o Beschrijvende analyses (verschil gemiddelden)
- Hoofdanalyses
o Verklarende analyses (uitpartialiseren storende variabelen, geslacht heeft
misschien effect maar als je ook studiekeuze erbij pakt dan niet meer, kan
doordat er meer meisjes bij psychologie zitten)
o Bevestigende analyses (andere analyses voor zelfde vraag, andere soort toets)
o Synthetiserende analyses (tegenstrijdigheden verklaren)
o Assumpties controleren (moet je mee oppassen)
- Vervolganalyses
o Tracerende analyses (mediërende variabelen, analyse uitbreiden)
o Invariantie analyses (subgroepen onderverdelen)
o Post hoc toetsen
Voorbeeld statistiek 2Ba
Welke analyses kun je hiermee doen? Specificeer dit ook echt, naam van de
analyse, AV, WS, BS, CO en indeling van metingen waar nodig. Voorbeelden uit zaal:
- T-toets onafhankelijke steekproef, als AV
verschilscores, BS geslacht
- GLM repeated measures, WS voor en na, AV
correct aantal antwoorden, BS factor geslacht
(indeling meting WS: correct1 en correct2)
- T-toets voor gekoppelde paren met Correct1 en
Correct2
- Gemiddelden berekenen
- ANCOVA, geslacht als BS, Correct1 als CO en
Correct2 als AV
Deze analyses zijn niet allemaal verschillend, de t-toetsen
en gemiddelden kunnen ook gevonden worden via de
GLM, de ANCOVA is dan wel weer echt een andere
analyse. Analyses bevatten elkaar, aanleiding hiervoor kan je zien door zelfde p-waarde
Hoe onderzoek je assumpties
- Helemaal niet?
o Meest gebruikelijk in psychologie
- Toetsing?
o Nee! Geeft een soort nepzekerheid maar wordt op internet helaas soms
geadviseerd
- Visuele inspectie
o Is een optie, maar met welke vuistregels werk je en waar ligt de grens?
- Vuistregel
, o Moet gepubliceerd zijn
- Kan op meerdere manieren
o Van makkelijk tot moeilijk, van oppervlakkig tot grondig
- Exploratief?
o Exploratieve analyses moet je altijd doen, maar
o Assumpties kun je pas onderzoeken als de hoofdanalyse bekend is
- Analyse doen waarbij de assumpties niet aanwezig zijn
o Stel je weet niet of iets normaal verdeeld is, dan pak je niet de t-toets maar
bijvoorbeeld non-parametrische toets
o Beste optie volgens Jules
Adviezen
Van beste naar slechtst maar ook van minst gedaan naar vaakst gedaan
- Doe een analyse die de assumptie niet nodig heeft
- Gebruik een peer-reviewed gepubliceerde vuistregel om de assumptie te
onderzoeken
- Toets de assumptie met een statistische toets
- Negeer de assumptie
Waarom is het vaak verkeerd om assumpties te toetsen?
Voorbeeld t-toets onafhankelijke steekproeven:
Sommige boeken zeggen: doe eerst levene’s test,
beslis op grond daarvan of je de ene of de andere t-
toets gebruikt. Lijkt logisch, maar is fout je kunt beter
direct de tweede gebruiken. F toets kan nooit met
zekerheid bepalen of de varianties gelijk zijn of die precies gelijk zijn is ook niet zo van belang
en F-toets toetst of ze éxact gelijk zijn en F toets is ook afhankelijk van scheefheid en t-toets
niet
- Assumptions of the t-test for independent samples:
o Independent simple draws, not multilevel
o Fixed sample size, set a priori
o Fixed decision rule: reject H0 if t > tcrit
o Normality
o Equal variances?
- Checking assumptions:
o Check normality and variances in sample
o Decide to use t-test or not
- Checking assumption creates a violation of assumptions
o It is not recommended in some undergraduate statistics books
o But not in peer reviewed
articles in statistical journals?
o E.g., recommended by Field,
based on SPSS help, based on
Hays (1973)
o But Hays recommends the
opposite